
About
Complex problems call for creative solutions. Our mission is to connect humans with data to gain insights for better outcomes.
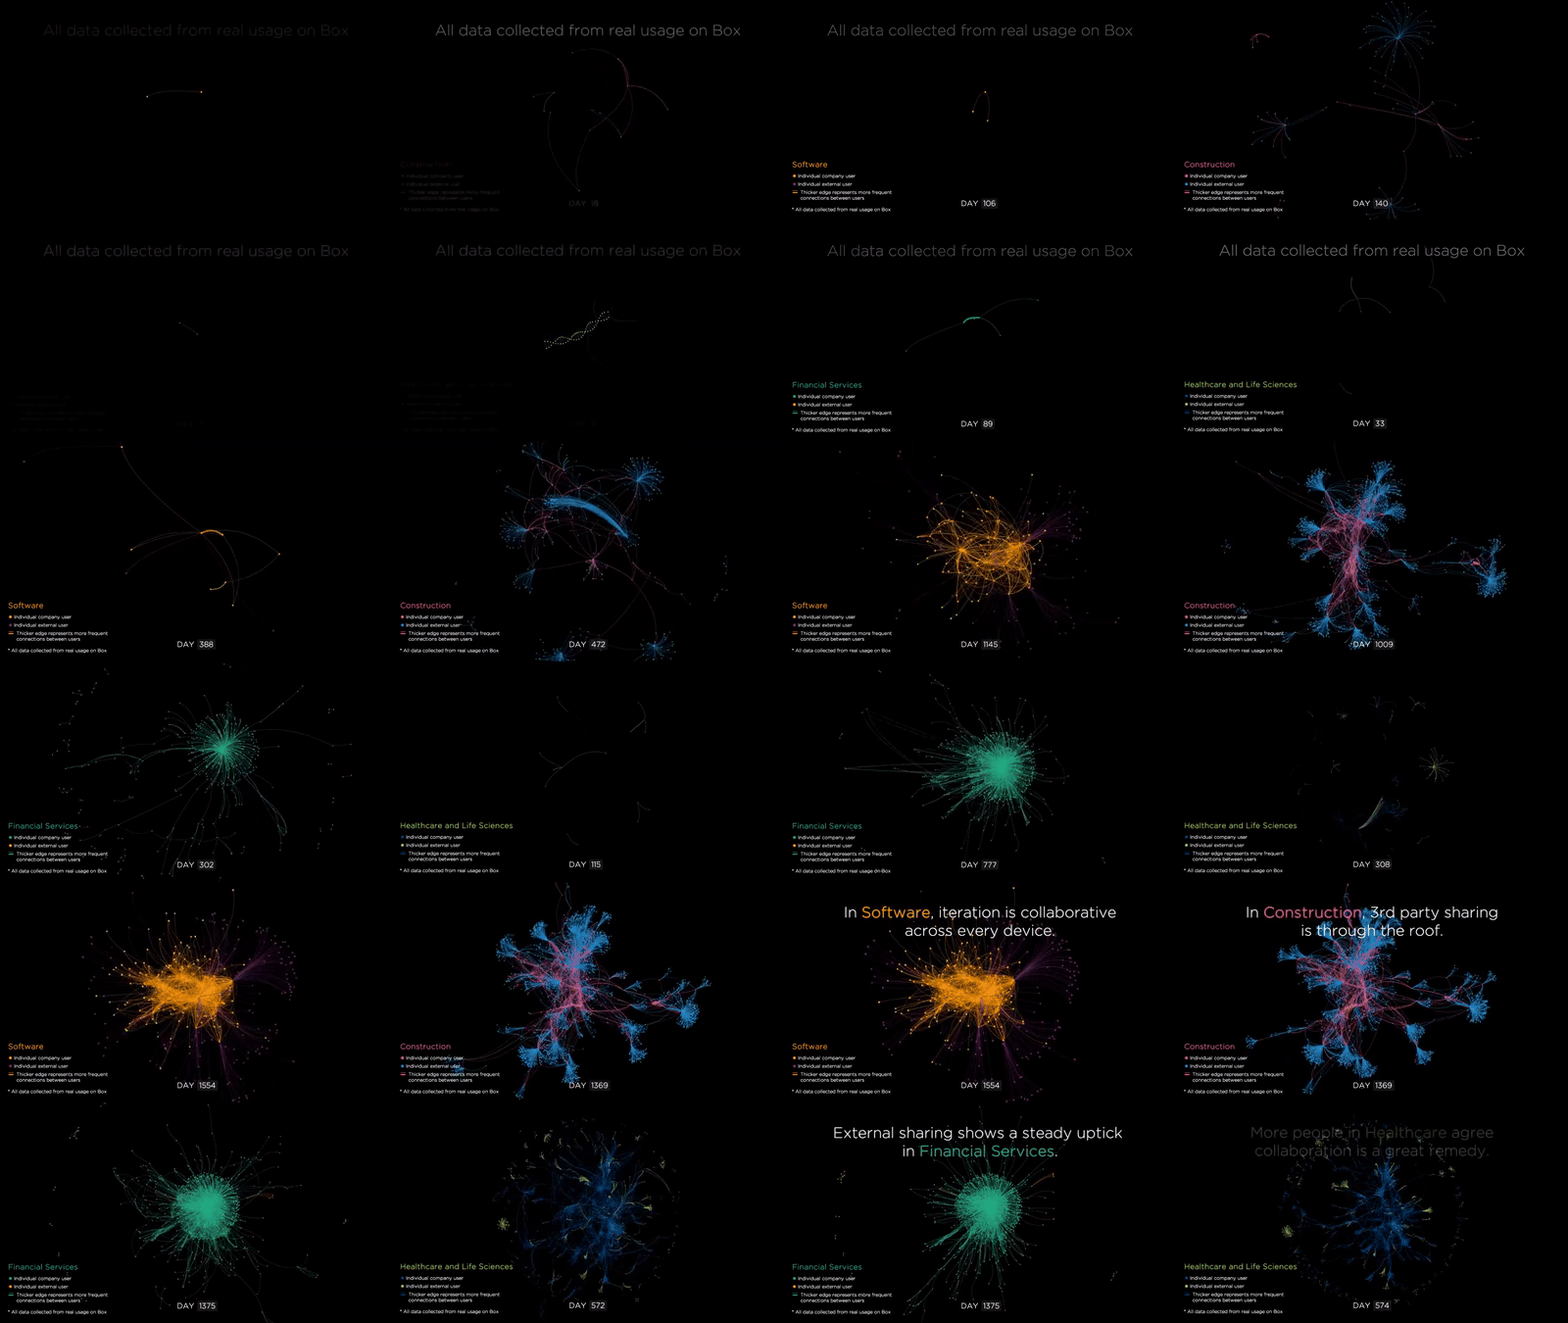
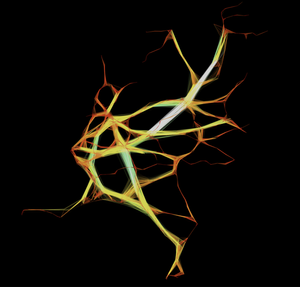
What does collaboration look like? That question led to the creation of these visualizations and to the founding of Kineviz as a spinoff from Kinetech Arts (a non-profit collective exploring the intersection of science, art, and technology). This kinetic visualization (that’s where we get our name!) inspired a series of consulting projects and, eventually, the creation of Kineviz.
We are scientists, engineers, artists and problem-solvers, crafting solutions that allow you to transform complex data into valuable insights through visualization.
Founded in 2015, Kineviz was built on a foundation of technology and creativity. As our technology advances, our community expands, providing support to world-class businesses, agencies, and nonprofits while maintaining self-sustainability.
Our posts featuring artists who explore the beauty of graph data visualization.
Art of Graph
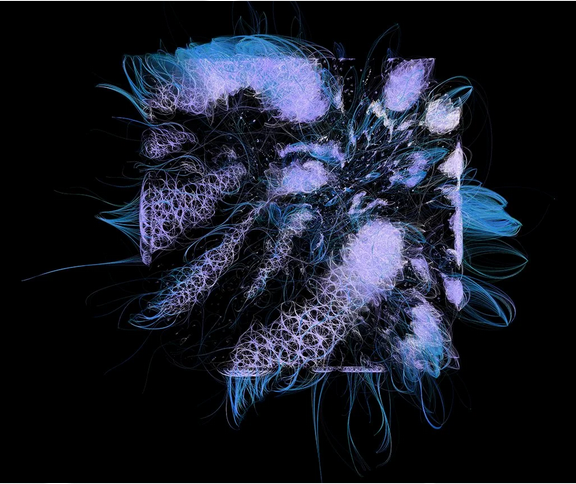
"Triumph" - A testament to the life-saving power of science and technology
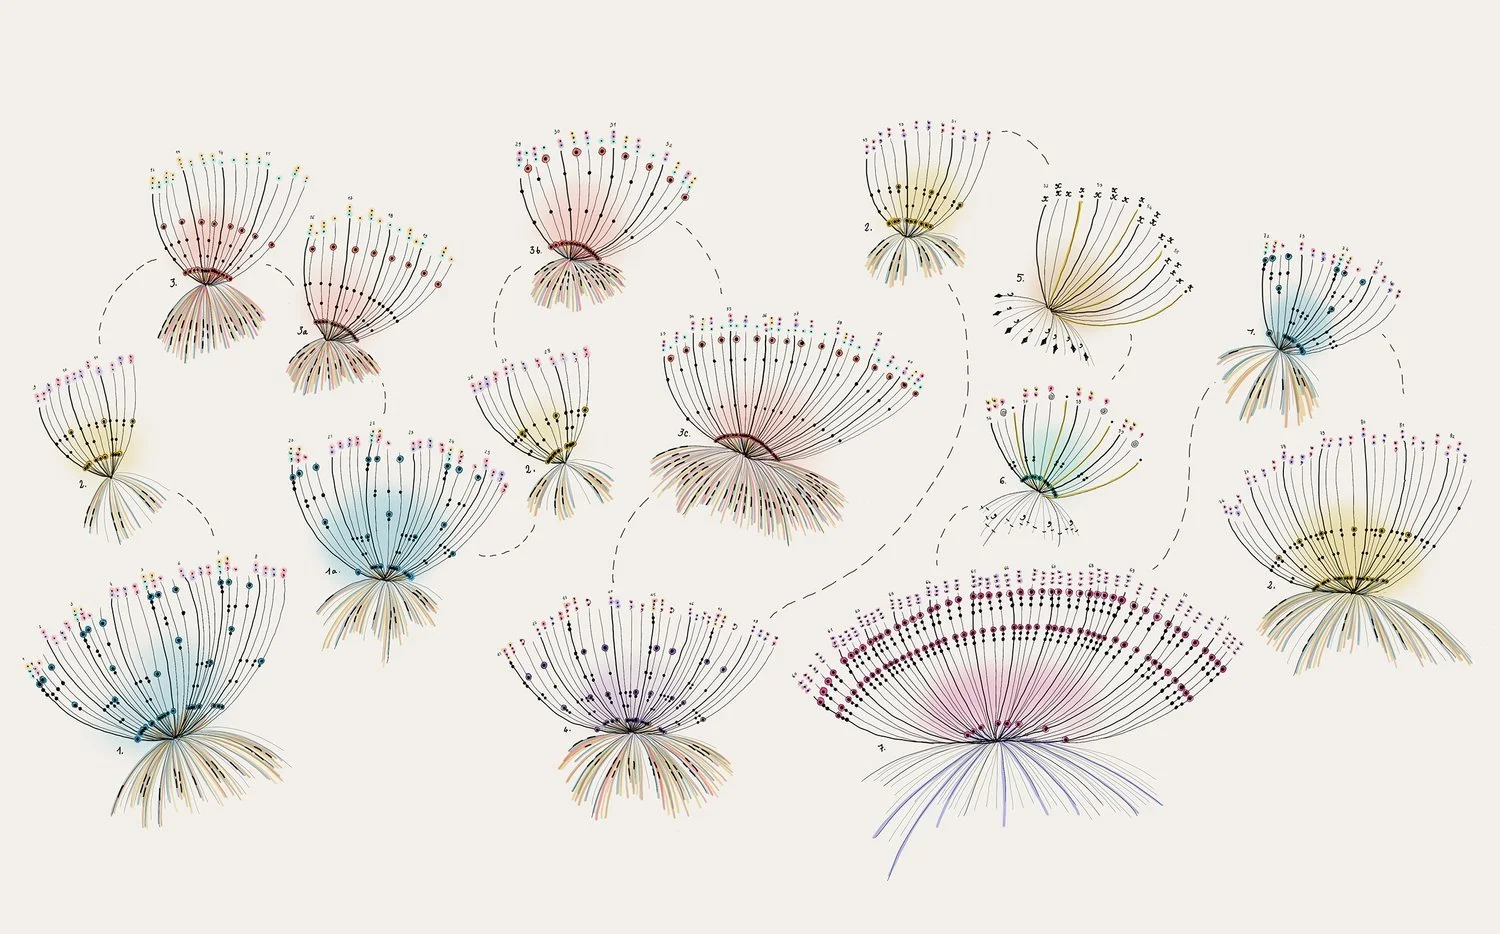
A dialogue between four hands: Giogia Lupi’s Data Humanism
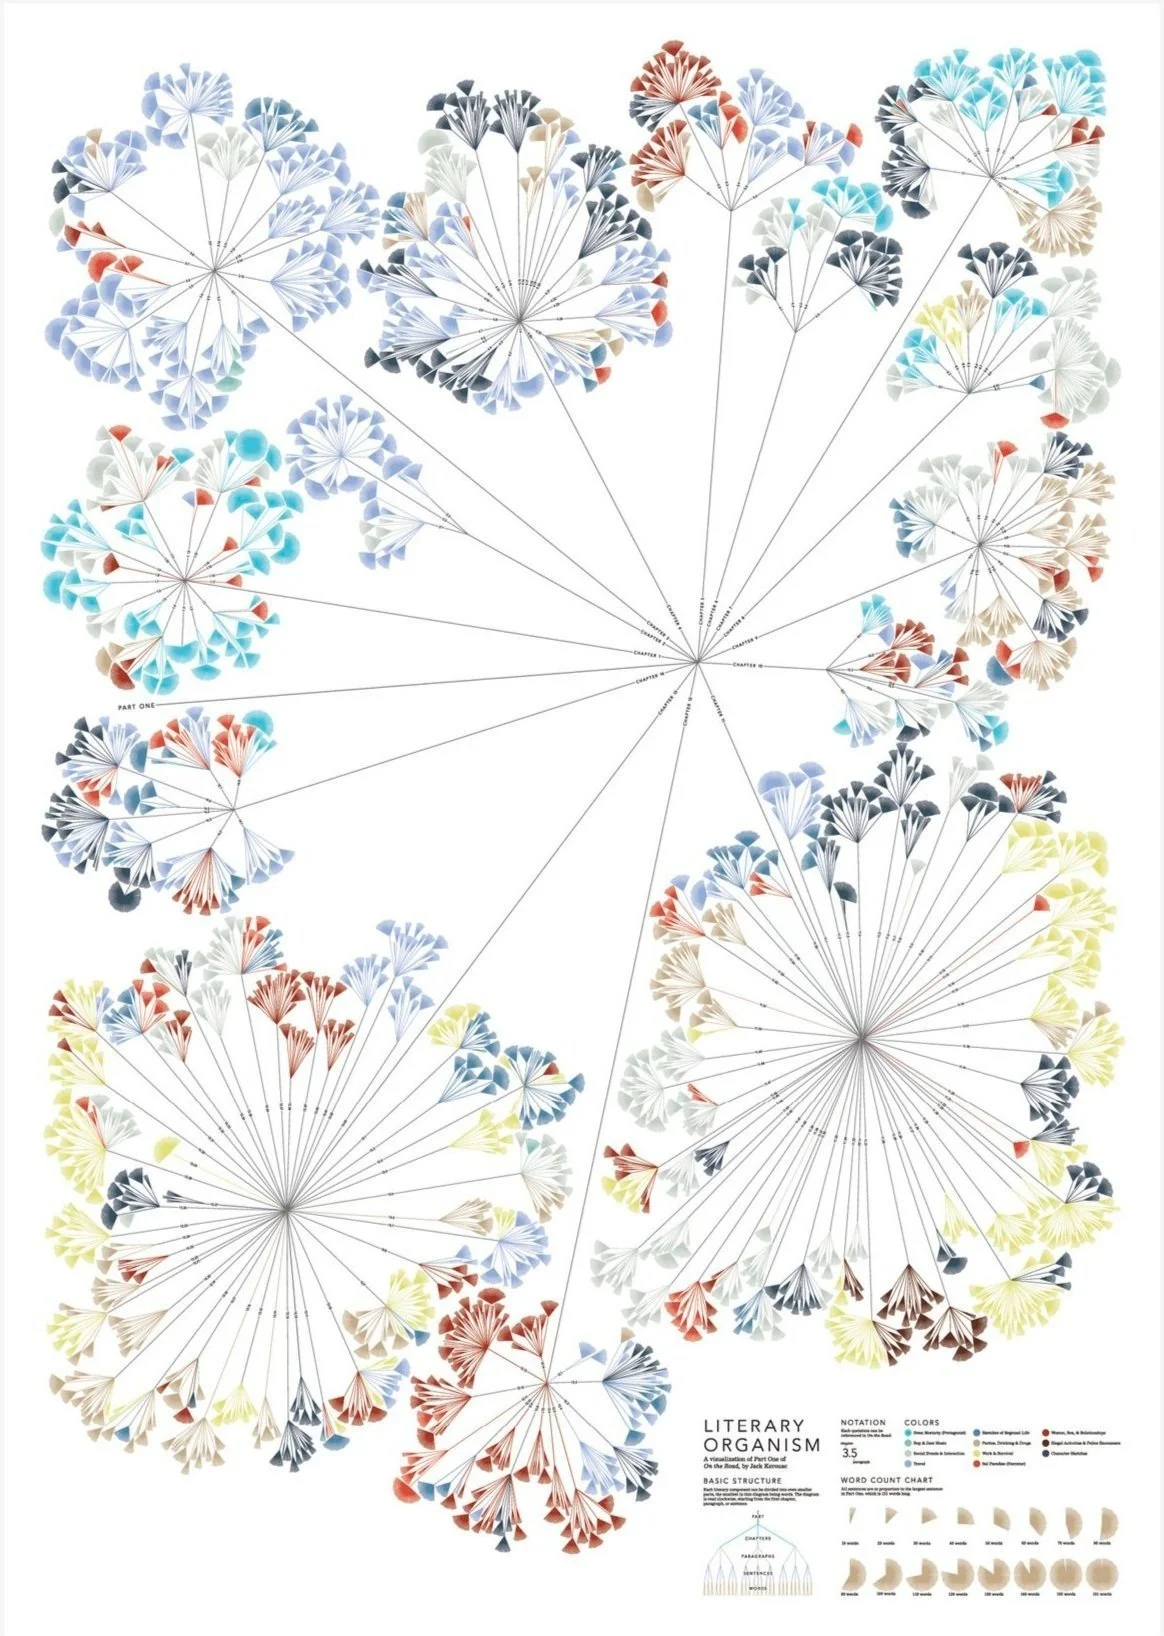
Literary Organisms: Visualizing the underlying structure of text
Distorting geography to show train travels
Join us in shaping the future of data visualization.
Frequently Asked Questions
What is Kineviz?
Kineviz is a software company whose mission is to connect humans with data to gain insights for better outcomes. Founded in 2015, Kineviz brings together scientists, engineers, artists, and problem-solvers who craft solutions that transform complex data into valuable insights through data visualization and AI, serving world-class businesses, agencies, and nonprofits.
When was Kineviz founded and where did it come from?
Kineviz was founded in 2015 as a spinoff from Kinetech Arts, a non-profit collective exploring the intersection of science, art, and technology. Early kinetic visualization experiments — the source of the Kineviz name — inspired a series of consulting projects that eventually led to the creation of the company, built on a foundation of technology and creativity.
What makes Kineviz different from other graph visualization companies?
Kineviz stands apart by combining scientific and engineering rigor with an artistic heritage: the company grew out of Kinetech Arts, a collective exploring science, art, and technology. Where many vendors focus purely on tooling, Kineviz's team of scientists, engineers, and artists is guided by the belief that complex problems call for creative approaches.
What is Kineviz's mission?
Kineviz's mission is to connect humans with data to gain insights for better outcomes. The company pursues this by crafting visualization solutions that turn complex data into valuable insights, supporting world-class businesses, agencies, and nonprofits while maintaining self-sustainability as its technology advances and its community expands.
What is the Art of Graph series by Kineviz?
Art of Graph is a Kineviz content series featuring artists who explore the beauty of graph data visualization. Posts cover works such as "Triumph," Giorgia Lupi's Data Humanism, Literary Organisms (visualizing the underlying structure of text), and distorted-geography maps of train travel — reflecting Kineviz's roots at the intersection of science, art, and technology.
Who works at Kineviz?
Kineviz is a team of scientists, engineers, artists, and problem-solvers. That mix is intentional: the company was founded out of Kinetech Arts, a non-profit collective exploring science, art, and technology, and it applies both technical and creative disciplines to help organizations transform complex data into valuable insights through visualization.