
See the connections that matter
Your data already holds the answers. Kineviz reveals the relationships between them so you can make better decisions, faster.
Human-centered Intelligence
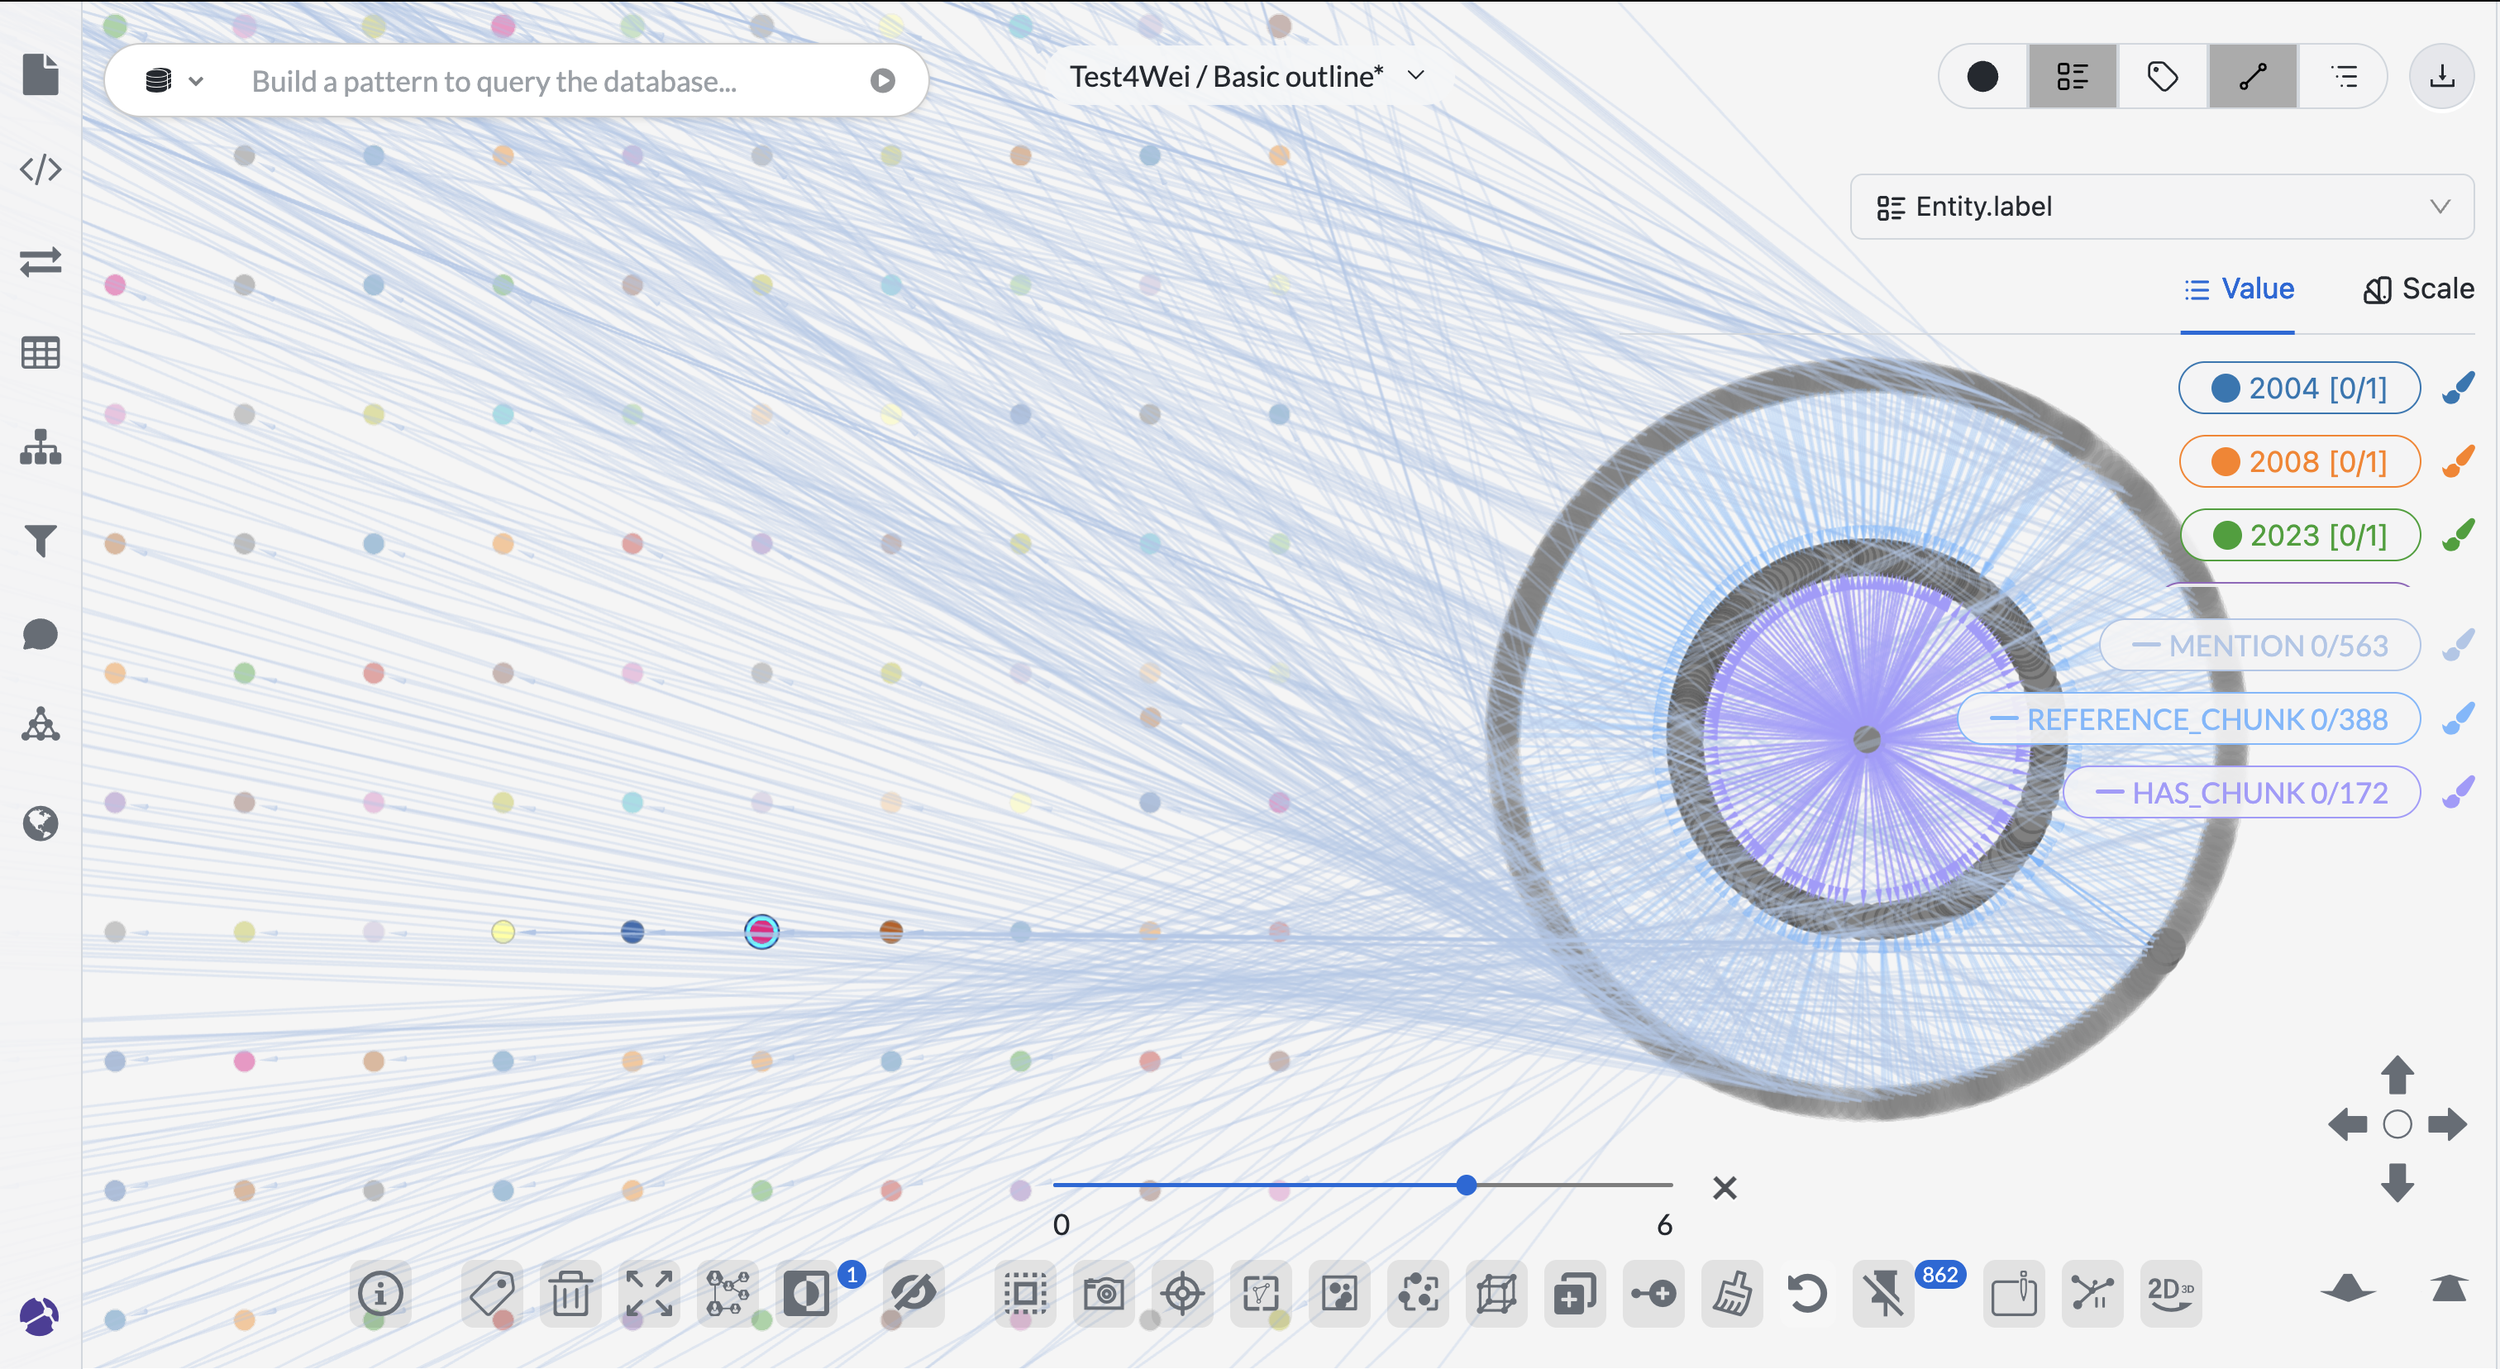
We provide a visual platform to collect and expand on complex connections in data, leveraging AI to reveal hidden patterns and provide stakeholders with the insights they need to make informed decisions.
Case Studies
From counter-terrorism to medicine, journalism to manufacturing.
Using network visualization to deplatform an extremist group from social media
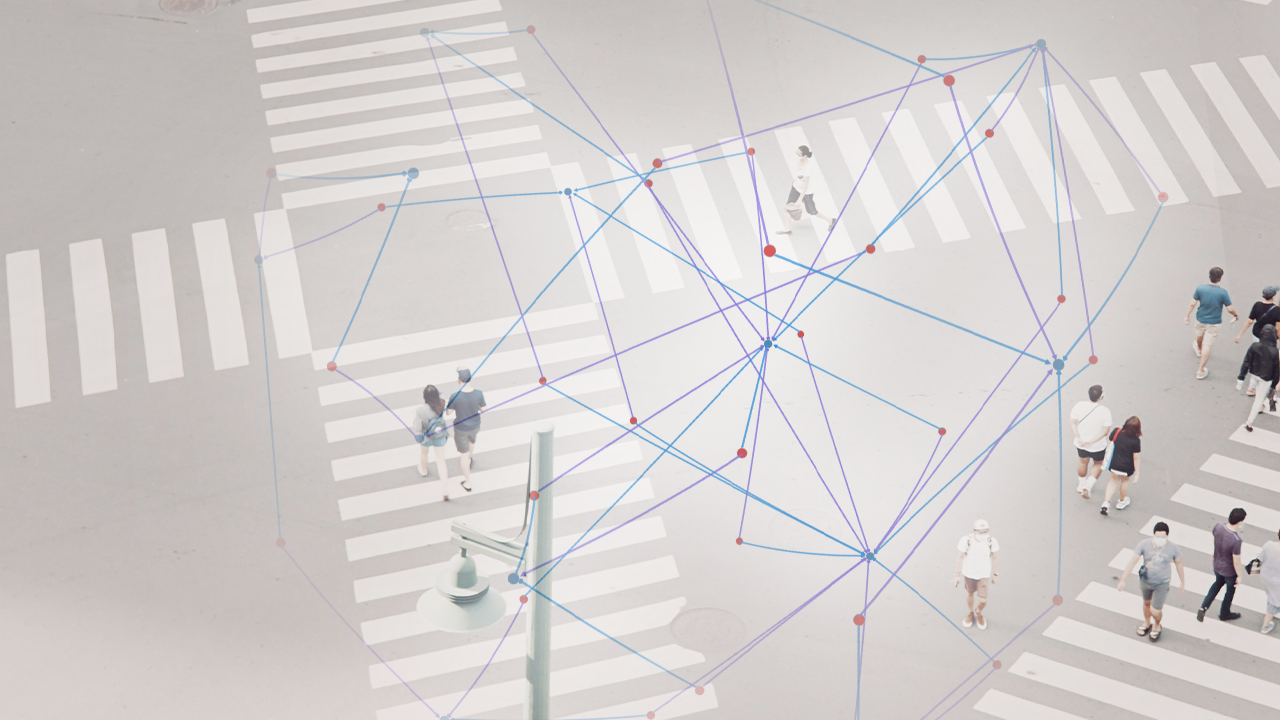
A multinational law enforcement agency found whack-a-mole ineffective against extremist recruiters on social media. To disrupt the recruitment operation, the LEA needed to deplatform the entire network of extremist-affiliated accounts simultaneously.

Visualizing Geospatial and Time Series Data for Law Enforcement
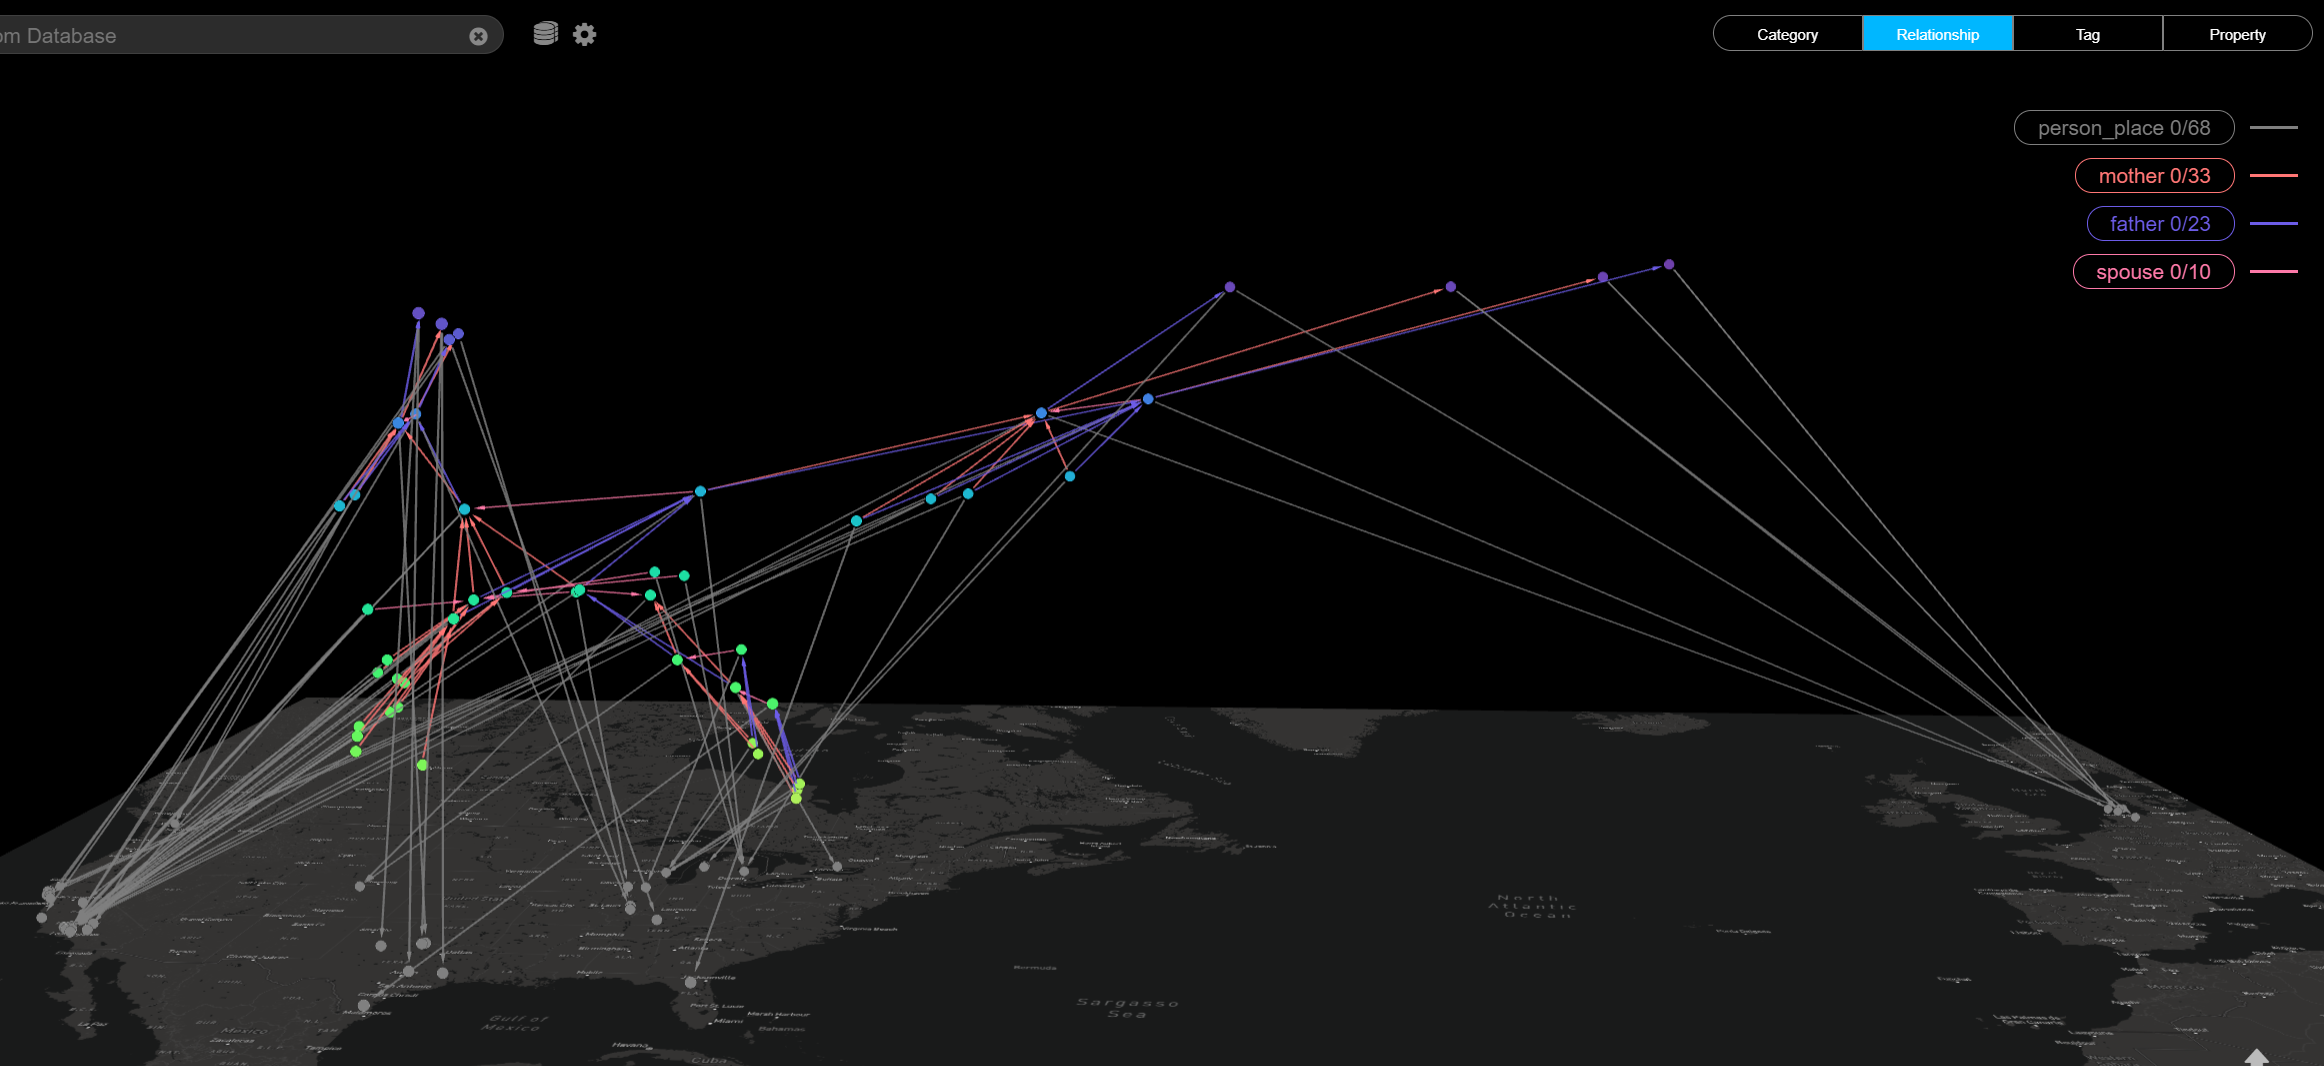
The Dutch police used Kineviz to transform OSINT data into dynamic geospatial maps and provide rapid visualization and graph analysis, revealing unexpected patterns in illegal drug production.

Real-time big data threat detection in online gaming
When an online gaming platform needed to analyze a massive 40 million events per day, standard BI tools were overwhelmed—missing subtle signs of collusion and fraud. By integrating a real-time detection system with advanced big data analytics, they were able to quickly identify evolving threats and take action before it was too late.

Fighting collusion in gaming using graph
A horse racing regulator sought to create a faster, more effective workflow that its small team of investigators could use to tackle fraud, expose criminal networks, and strengthen data integrity. The most pressing focus was to examine instances of potential collusion, while maintaining high confidence in the accuracy of their findings.
“You just enabled us to do in 3 minutes what used to take us 3 days.”
Manager, Betting & Intelligence Unit
Frequently Asked Questions
What is Kineviz?
Kineviz is a graph data visualization platform that turns connected data — people, accounts, transactions, events — into interactive visual graphs you can explore, analyze, and share. Its AI agents take on the legwork of pattern discovery, surfacing hidden relationships while keeping every finding traceable to source data, and analytics like community detection, centrality, and shortest path are built in. Kineviz runs in the browser (Kineviz Online) or as a downloadable desktop app (Kineviz Desktop).
What is graph data visualization software used for?
Graph data visualization software displays entities as nodes and relationships as edges, making hidden connections visible for faster decision-making. Kineviz customers use it across a range of domains including counter-terrorism, fraud detection, supply chain, customer 360/KYC, cybersecurity, and game analytics — for example, a law enforcement agency used Kineviz network visualization to map and deplatform an entire extremist recruitment network on social media simultaneously, instead of playing whack-a-mole with individual accounts.
What is link analysis software in law enforcement?
Link analysis software helps investigators visualize relationships between people, accounts, locations, and events to expose criminal networks. Kineviz is used this way in practice: published case studies document investigators disrupting an international crime network (kineviz.com/disrupting-an-international-crime-network) and a law enforcement agency using network visualization to deplatform an extremist group from social media (kineviz.com/using-network-visualization-to-deplatform-an-extremist-group-from-social-media).
How does graph analytics help detect fraud and collusion?
Graph analytics detects fraud by revealing relationship patterns — shared accounts, coordinated behavior, money flows — that row-and-column BI tools miss. When an online gaming platform needed to analyze 40 million events per day, standard BI tools were overwhelmed; using Kineviz with real-time big data analytics, the platform identified evolving collusion and fraud threats early enough to act before losses mounted.
What is the best tool for visualizing relationships in data?
For relationship-centric analysis, a dedicated graph visualization platform like Kineviz outperforms general BI dashboards because it puts connections — not tables — at the center of the workflow. Kineviz combines visual graph exploration and built-in algorithms — community detection, centrality, shortest path — with AI that surfaces hidden patterns, and it has been applied across counter-terrorism, law enforcement, fraud detection, supply chain, customer 360/KYC, cybersecurity, and game analytics. One betting intelligence manager reported doing "in 3 minutes what used to take us 3 days."
Is Kineviz browser-based or a desktop application?
Both. Kineviz Online runs in the browser with no installation, while Kineviz Desktop brings the same connected-data analysis workspace to your computer with an embedded graph database and a built-in AI agent. Teams can launch Kineviz Online directly from kineviz.com or download Kineviz Desktop, choosing the deployment that fits their data and security requirements.
How does AI help with network analysis and investigations?
AI's job is to multiply what an analyst can cover, not to hand down answers: it accelerates network analysis by finding hidden patterns in connected data that manual review would miss, while humans stay in control of conclusions. Kineviz's approach is "human-centered intelligence": AI agents and visual analytics work together to surface relationships and insights, but the platform is built on the belief that questions should shape data models and AI tools should serve humans — not replace their judgment.