
Case Studies
Discover some of our solutions to real-world challenges through network visualization and collaboration.


Disrupting an International Crime Network
A multinational justice organization uncovered evidence that criminal syndicates were using a covert communications network to evade law enforcement. The investigations spanned organized violence, human trafficking, drug and weapons smuggling, and more than a billion dollars in criminal funds.
Fighting collusion in gaming using graph
A horse racing regulator sought to create a faster, more effective workflow that its small team of investigators could use to tackle fraud, expose criminal networks, and strengthen data integrity. The most pressing focus was to examine instances of potential collusion, while maintaining high confidence in the accuracy of their findings.

Real-time big data threat detection in online gaming
When an online gaming platform needed to analyze a massive 40 million events per day, standard BI tools were overwhelmed—missing subtle signs of collusion and fraud. By integrating a real-time detection system with advanced big data analytics, they were able to quickly identify evolving threats and take action before it was too late.
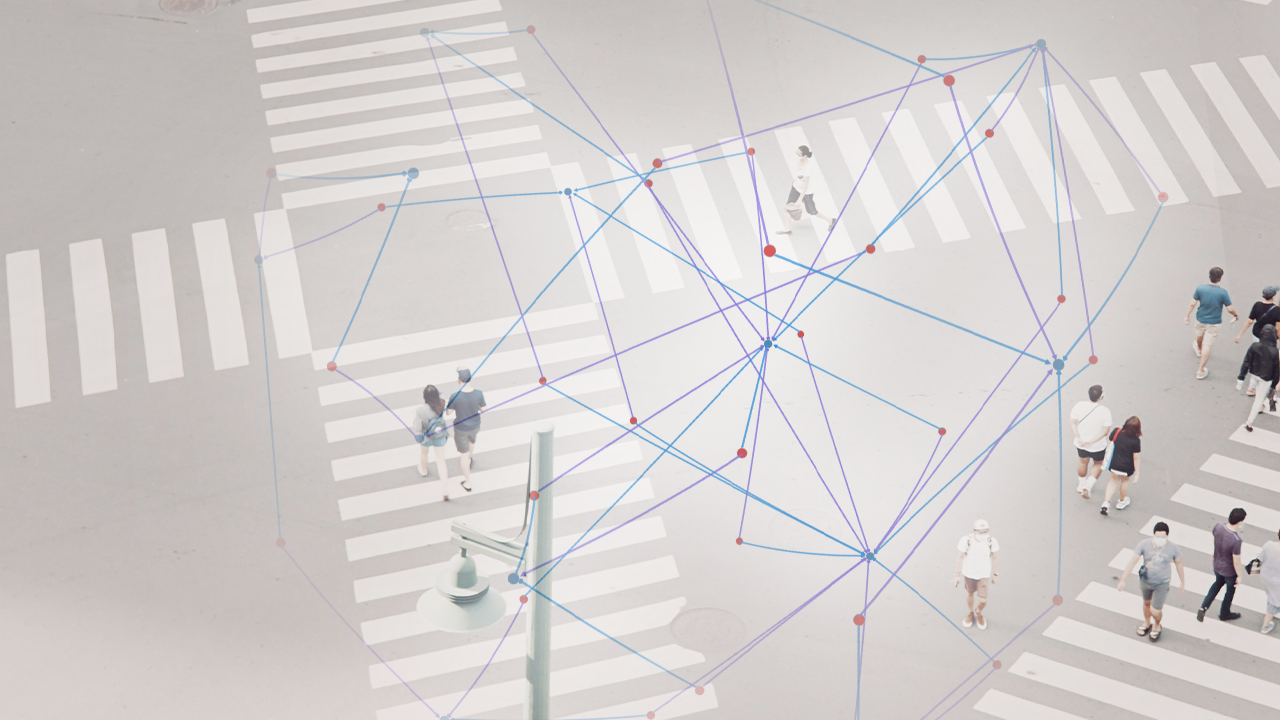
Using network visualization to deplatform an extremist group from social media
A multinational law enforcement agency found whack-a-mole ineffective against extremist recruiters on social media. Delete one account and they’d simply create another. To disrupt the recruitment operation, the LEA needed to deplatform the entire network of extremist-affiliated accounts simultaneously.

Visualizing geospatial and time series data for law enforcement
The Dutch police used Kineviz to transform OSINT data into dynamic geospatial maps and provide rapid visualization and graph analysis, revealing unexpected patterns in illegal drug production.

Sales Transformation With Remote Teams
The Gig Economy Group and Kineviz partnered to empower remote sellers with innovative tools in the COVID-19 era, leveraging Kineviz for real-time insights into sales interactions and enhancing remote work performance with AI-driven strategies.

Mobile App Leverages Connected Data through Geospatial Intelligence
Black and Veatch (BV) partners with Kineviz to provide real-time mapping technology that keeps projects moving while supporting worker safety during COVID-19 outbreaks.
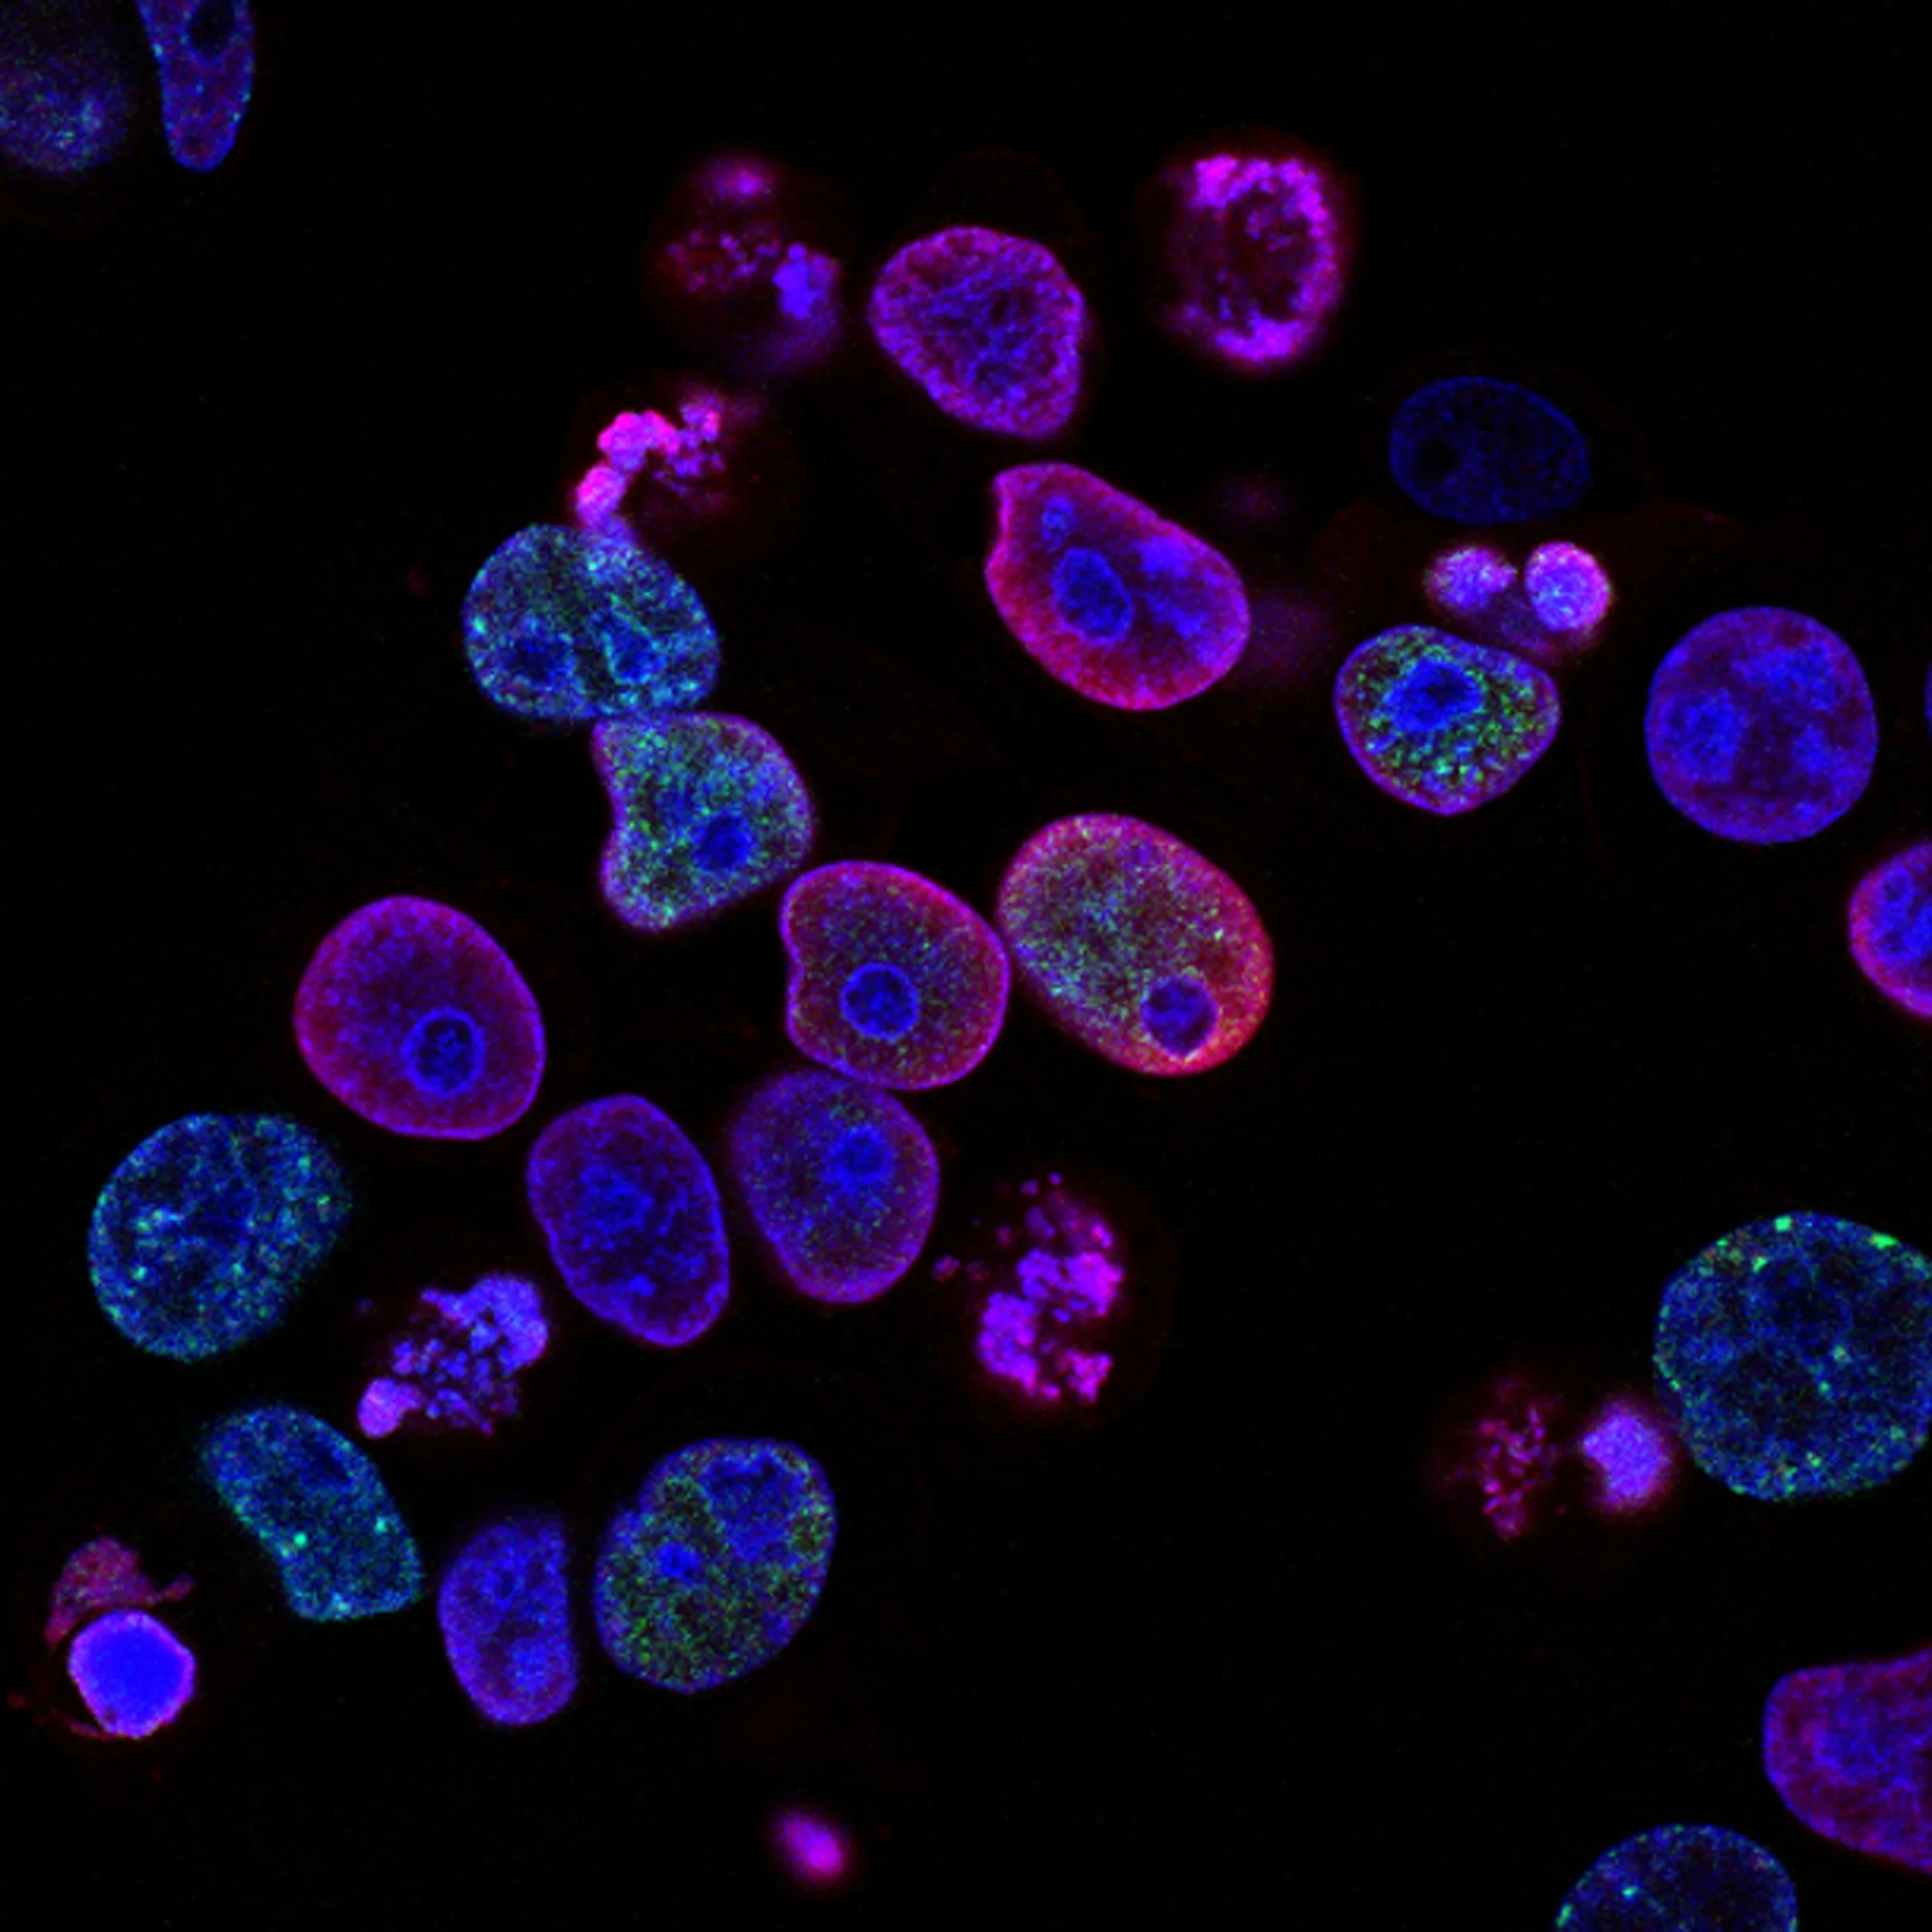
Expanding Fundamental Knowledge of TB with a Gene Regulatory Network Analysis Tool (TBRNAT)
The OCICB team at NIAID leverages interactive data visualization to explore M. tuberculosis transcription factors and their regulatory networks, offering insights into TB's virulence and potential therapeutic targets.
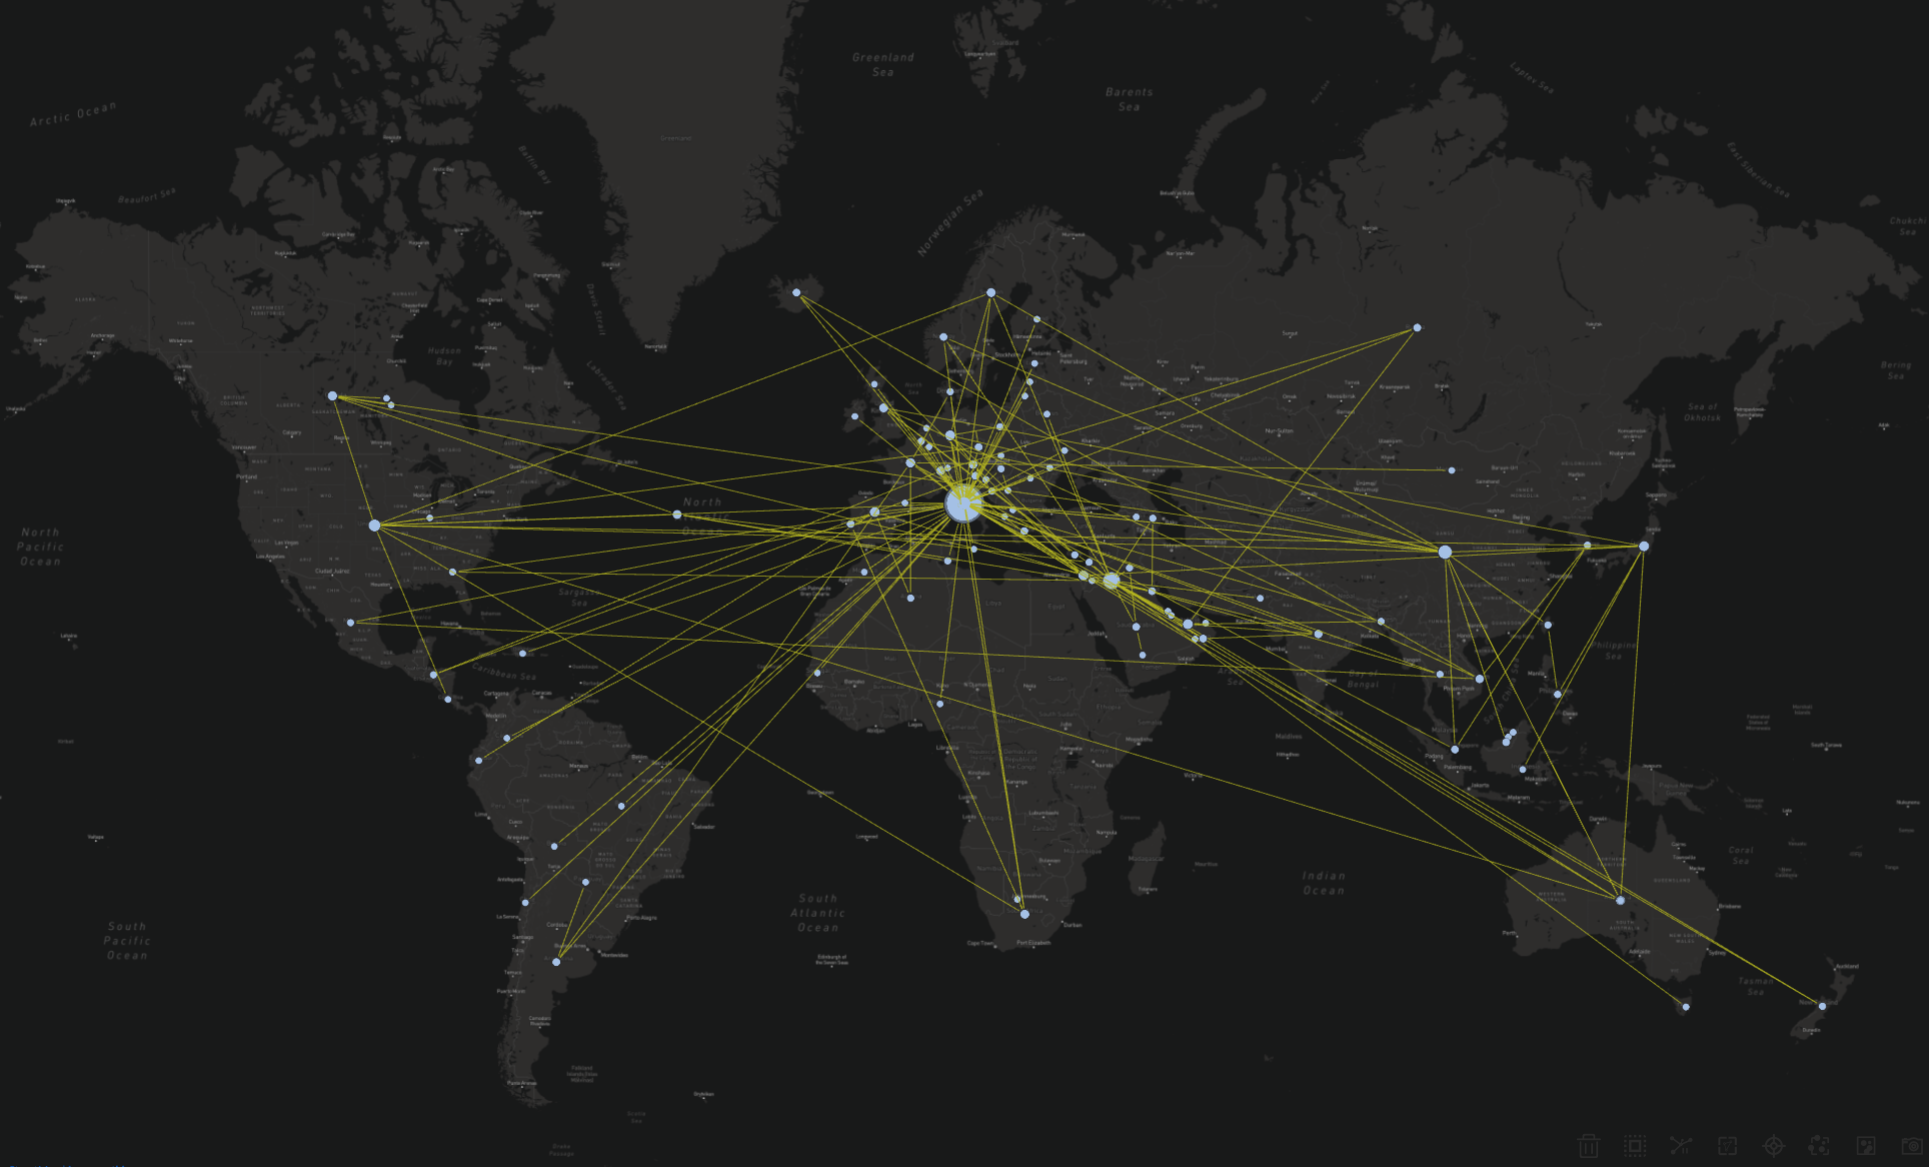
Human-led Machine Learning & Advanced Threats: Case Method Inquiry & Visual Analytics Applied to COVID-19
This graph-enabled strategy advocates treating COVID-19 as a complex, mutable actor, emphasizing global vaccine research collaboration, strategic communications, and human-led oversight in machine learning to holistically address the pandemic's challenges.
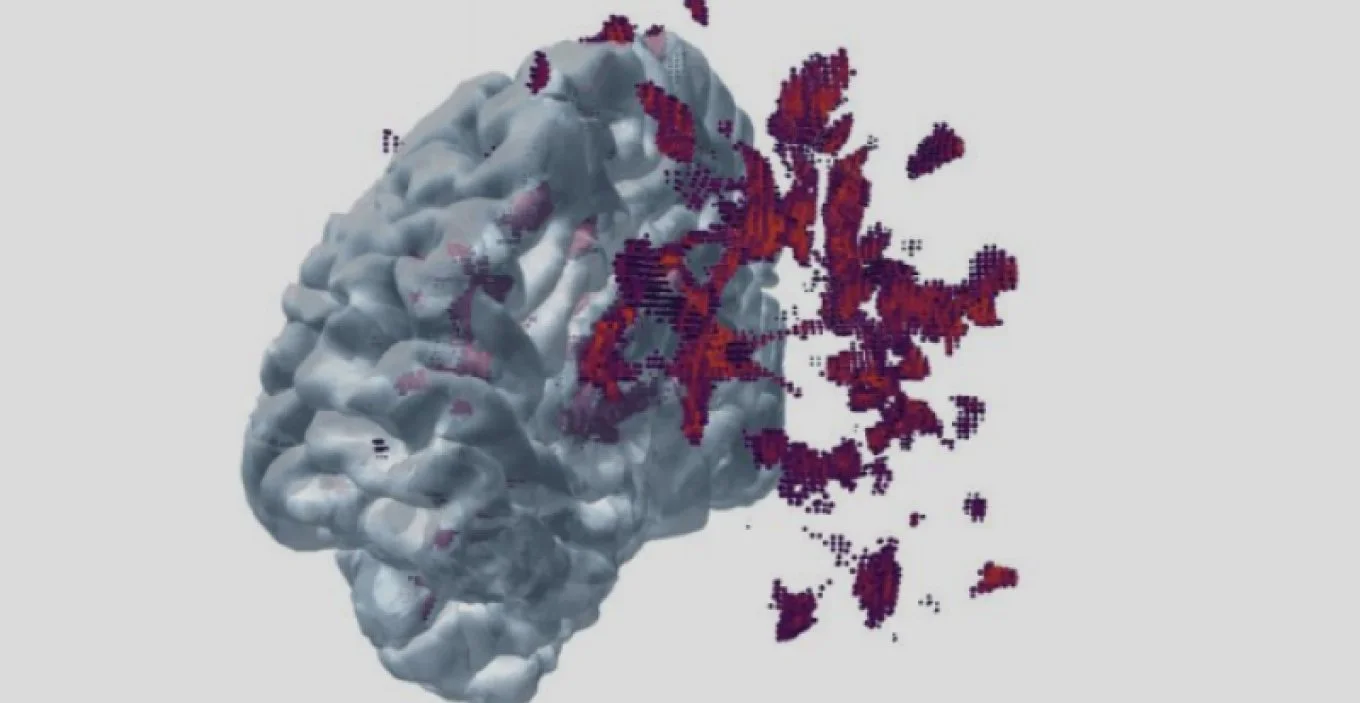
BrainGraph: A Novel Visualization of MRI Data as a 3D Graph
An interactive visualization of neuroimaging data expands capabilities in patient education, clinical insights, and image analysis.
Frequently Asked Questions
What are some real-world graph analytics case studies?
Kineviz publishes graph analytics case studies spanning crime investigation, fraud, and life sciences. Examples include disrupting an international crime network, deplatforming an extremist group from social media, detecting fraud in online gaming at 40 million events per day, and analyzing M. tuberculosis gene regulatory networks. Each shows how Kineviz (formerly GraphXR) turns connected data into visual, actionable insight for real investigations.
How is graph visualization used for fraud detection?
Graph visualization exposes the hidden connections and pathways that signal fraud and collusion. In Kineviz case studies, a horse racing regulator used GraphXR to expose criminal networks and examine potential collusion, and an online gaming platform analyzed 40 million events per day to catch subtle signs of fraud that standard BI tools missed, taking action before losses escalated.
Can graph analytics help law enforcement investigations?
Yes. Multiple Kineviz case studies show law enforcement using graph analytics to reveal criminal networks. A multinational justice organization uncovered a covert criminal communications network tied to trafficking and over a billion dollars in illicit funds, the Dutch police transformed OSINT data into geospatial maps revealing illegal drug production, and an agency deplatformed an entire network of extremist accounts at once.
What are common use cases for graph analytics?
Common graph analytics use cases include fraud detection, criminal network investigation, threat detection, geospatial and time-series analysis, and scientific research. Kineviz case studies cover all of these, from real-time big data threat detection in online gaming to visualizing MRI neuroimaging data as a 3D graph and mapping tuberculosis gene regulatory networks for drug research.
How do investigators detect collusion in gaming with graph analysis?
Investigators detect collusion by visualizing relationships between players, accounts, and transactions to expose coordinated behavior. In Kineviz case studies, a horse racing regulator built a faster investigator workflow to examine potential collusion while maintaining confidence in accuracy, and an online gaming platform paired real-time detection with big data analytics to identify evolving collusion and fraud threats.
Can graph visualization be used for scientific and medical research?
Yes. Kineviz case studies show graph visualization applied to life sciences and healthcare. The NIAID OCICB team built a Gene Regulatory Network Analysis Tool to explore M. tuberculosis transcription factors and therapeutic targets, while BrainGraph renders MRI neuroimaging data as an interactive 3D graph to support image analysis, clinical insight, and patient education.
How does Kineviz help disrupt criminal or extremist networks online?
Kineviz uses network visualization to map an entire network so it can be disrupted at once rather than account by account. One case study describes a law enforcement agency that found deleting single extremist accounts ineffective, so it used GraphXR to visualize and deplatform the full network of affiliated accounts simultaneously, undermining the recruitment operation.