News
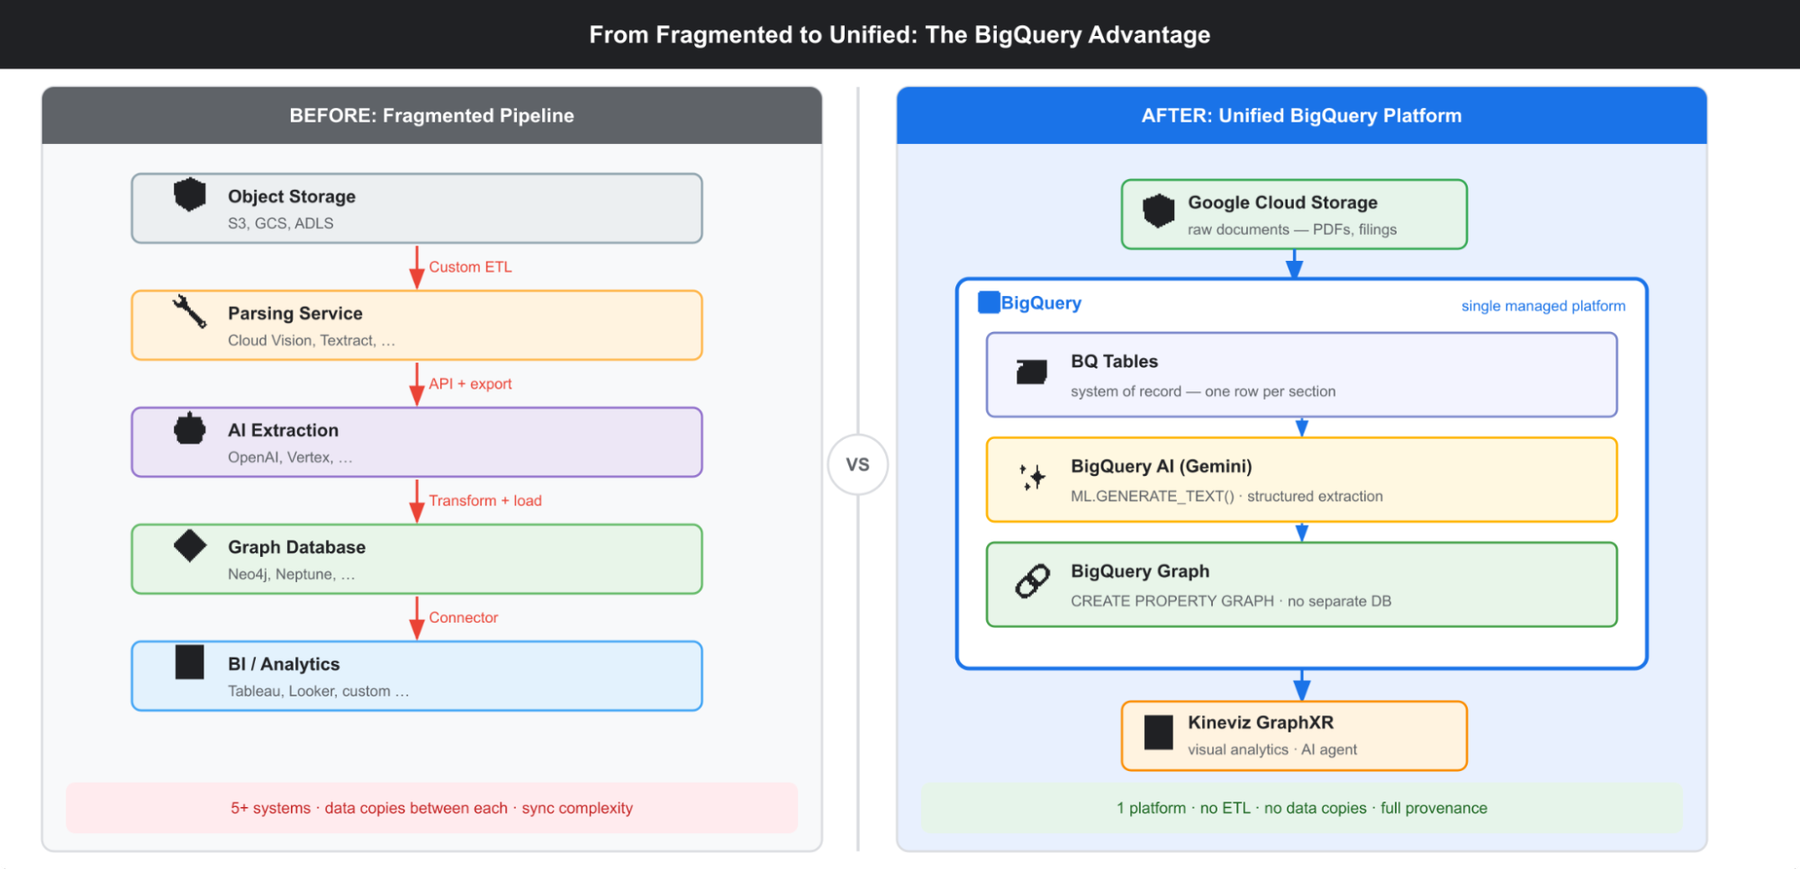
Together with BigQuery AI Functions and BigQuery Graph, Kineviz gives enterprises a streamlined way to turn unstructured data — PDFs, emails, regulatory filings — into explorable, visual knowledge graphs without complex ETL pipelines or separate graph databases.
Analysts can visually verify relationships, trace insights back to source documents, and answer complex questions interactively, all within a single workflow.
Read the full blog post by our CEO Weidong Yang and Google's Candice Chen to see how it works


Meet Weidong and Sony at Google Next
Previously
A look back at some of the things we've explored.
Graph Chat with Sony Green on the Evolution of Graph Intelligence
In this Graph Chat from ODSC, Sony Green (COO of Kineviz) joins Bryce Merkl Sasaki to discuss how graph technology is moving from a niche tool to a mainstream enterprise powerhouse. Highlights:
The Spanner Graph Impact: Why Google’s entry into the graph space is a watershed moment for big data and high consistency.
Human-Centric AI: A look at Knowledge Mapping—helping law enforcement and investigators find absolute truths in unstructured data without relying on AI-generated conclusions.
No-Code Graphing: Introduction of the Graph Composer, a tool designed to map disparate data sources into a graph model with zero coding.
Scaling unstructured enterprise knowledge with BigQuery Graph and Kineviz
Over 80% of enterprise data lives in unstructured form — PDFs, emails, reports, regulatory filings. Most of the time, such sources contain critical business information, yet they remain difficult to access and reason over at scale. Together, BigQuery Graph and Kineviz GraphXR give decision makers power over their unstructured data by creating a single, streamlined workflow that makes it much easier to uncover hidden business insights.
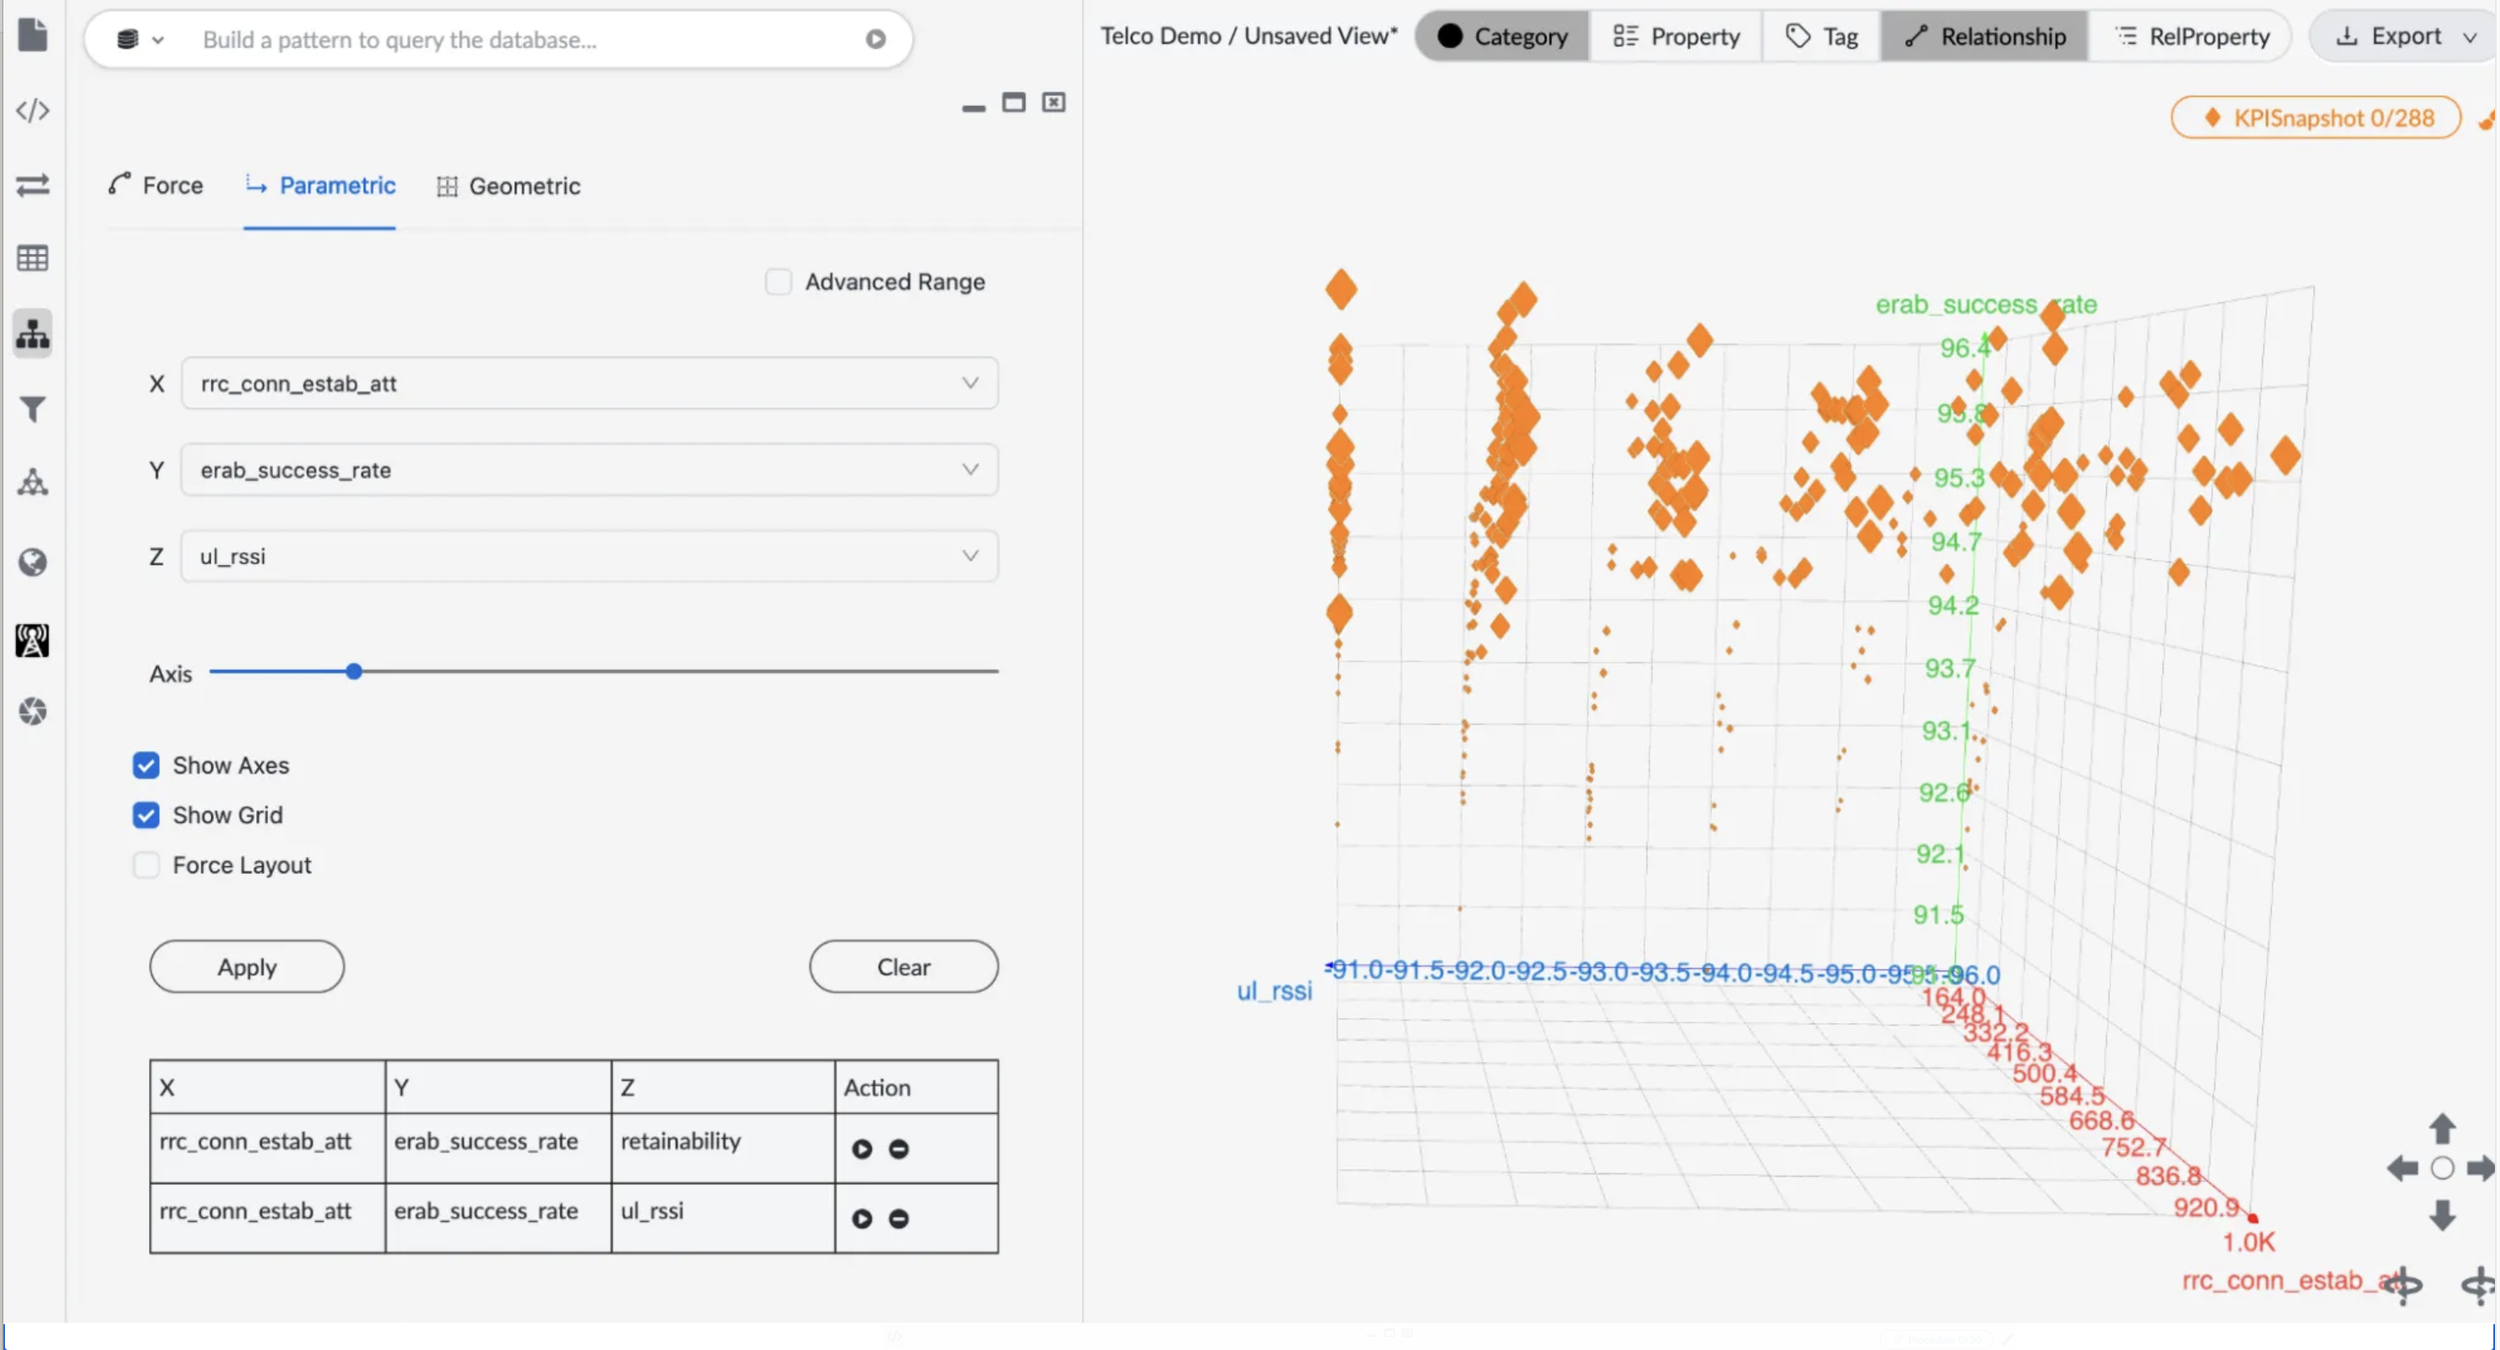
From Spanner Graph to Operational Insight: Visual Telco Analysis with Kineviz
Communication Service Providers (CSPs) are building autonomous networks while tackling the exploding complexity of modern telecommunications. This shift requires more than just automation alone: it demands a responsive human oversight layer paired with a dynamic visualization system that can detect emerging incident patterns, retrieve relevant data, generate intuitive views, and feed insights back into the network.
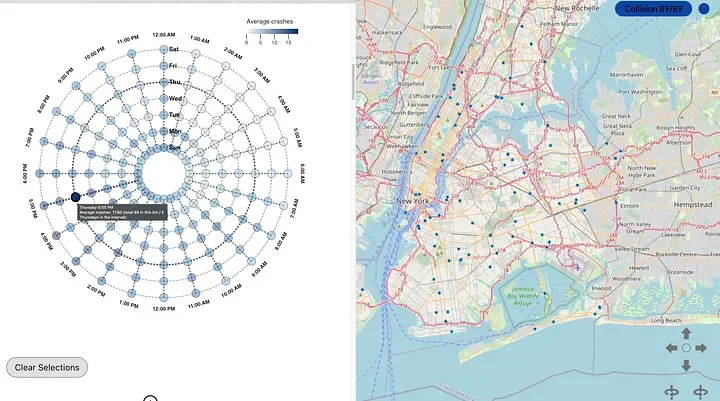
How to Pinpoint NYC’s Most Dangerous Driving Hours Using Data
When is it safer to drive in New York City?
Using Kineviz and motor vehicle collision data, we mapped crash patterns across every hour and day of the week. Our WeekDial visualization transforms temporal and geographic data into actionable insights for urban traffic safety.
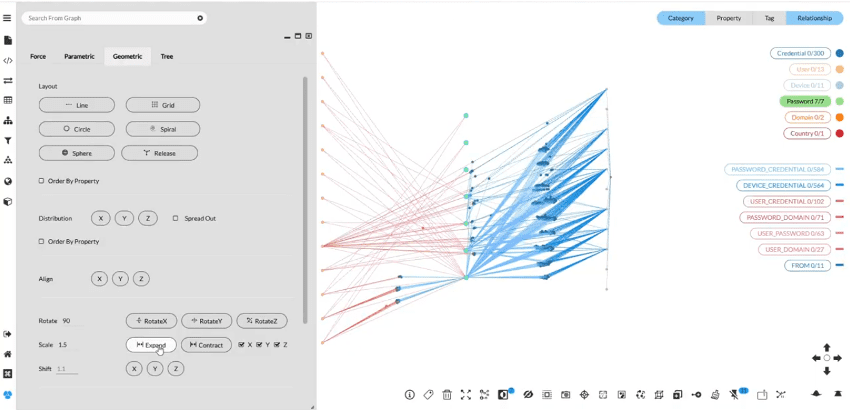
Understanding the Two Sides of Infostealer Risk: Employees and Users
Infostealer malware dominates today’s cyber threat landscape. Designed to extract credentials, cookies, session tokens, autofill data, and other forms of digital identity, infostealers operate silently, persistently, and at industrial scale. There are two critical vectors of risk: employee-driven and user-driven infections. Yet many organizations treat these threats uniformly, without differentiating between them.
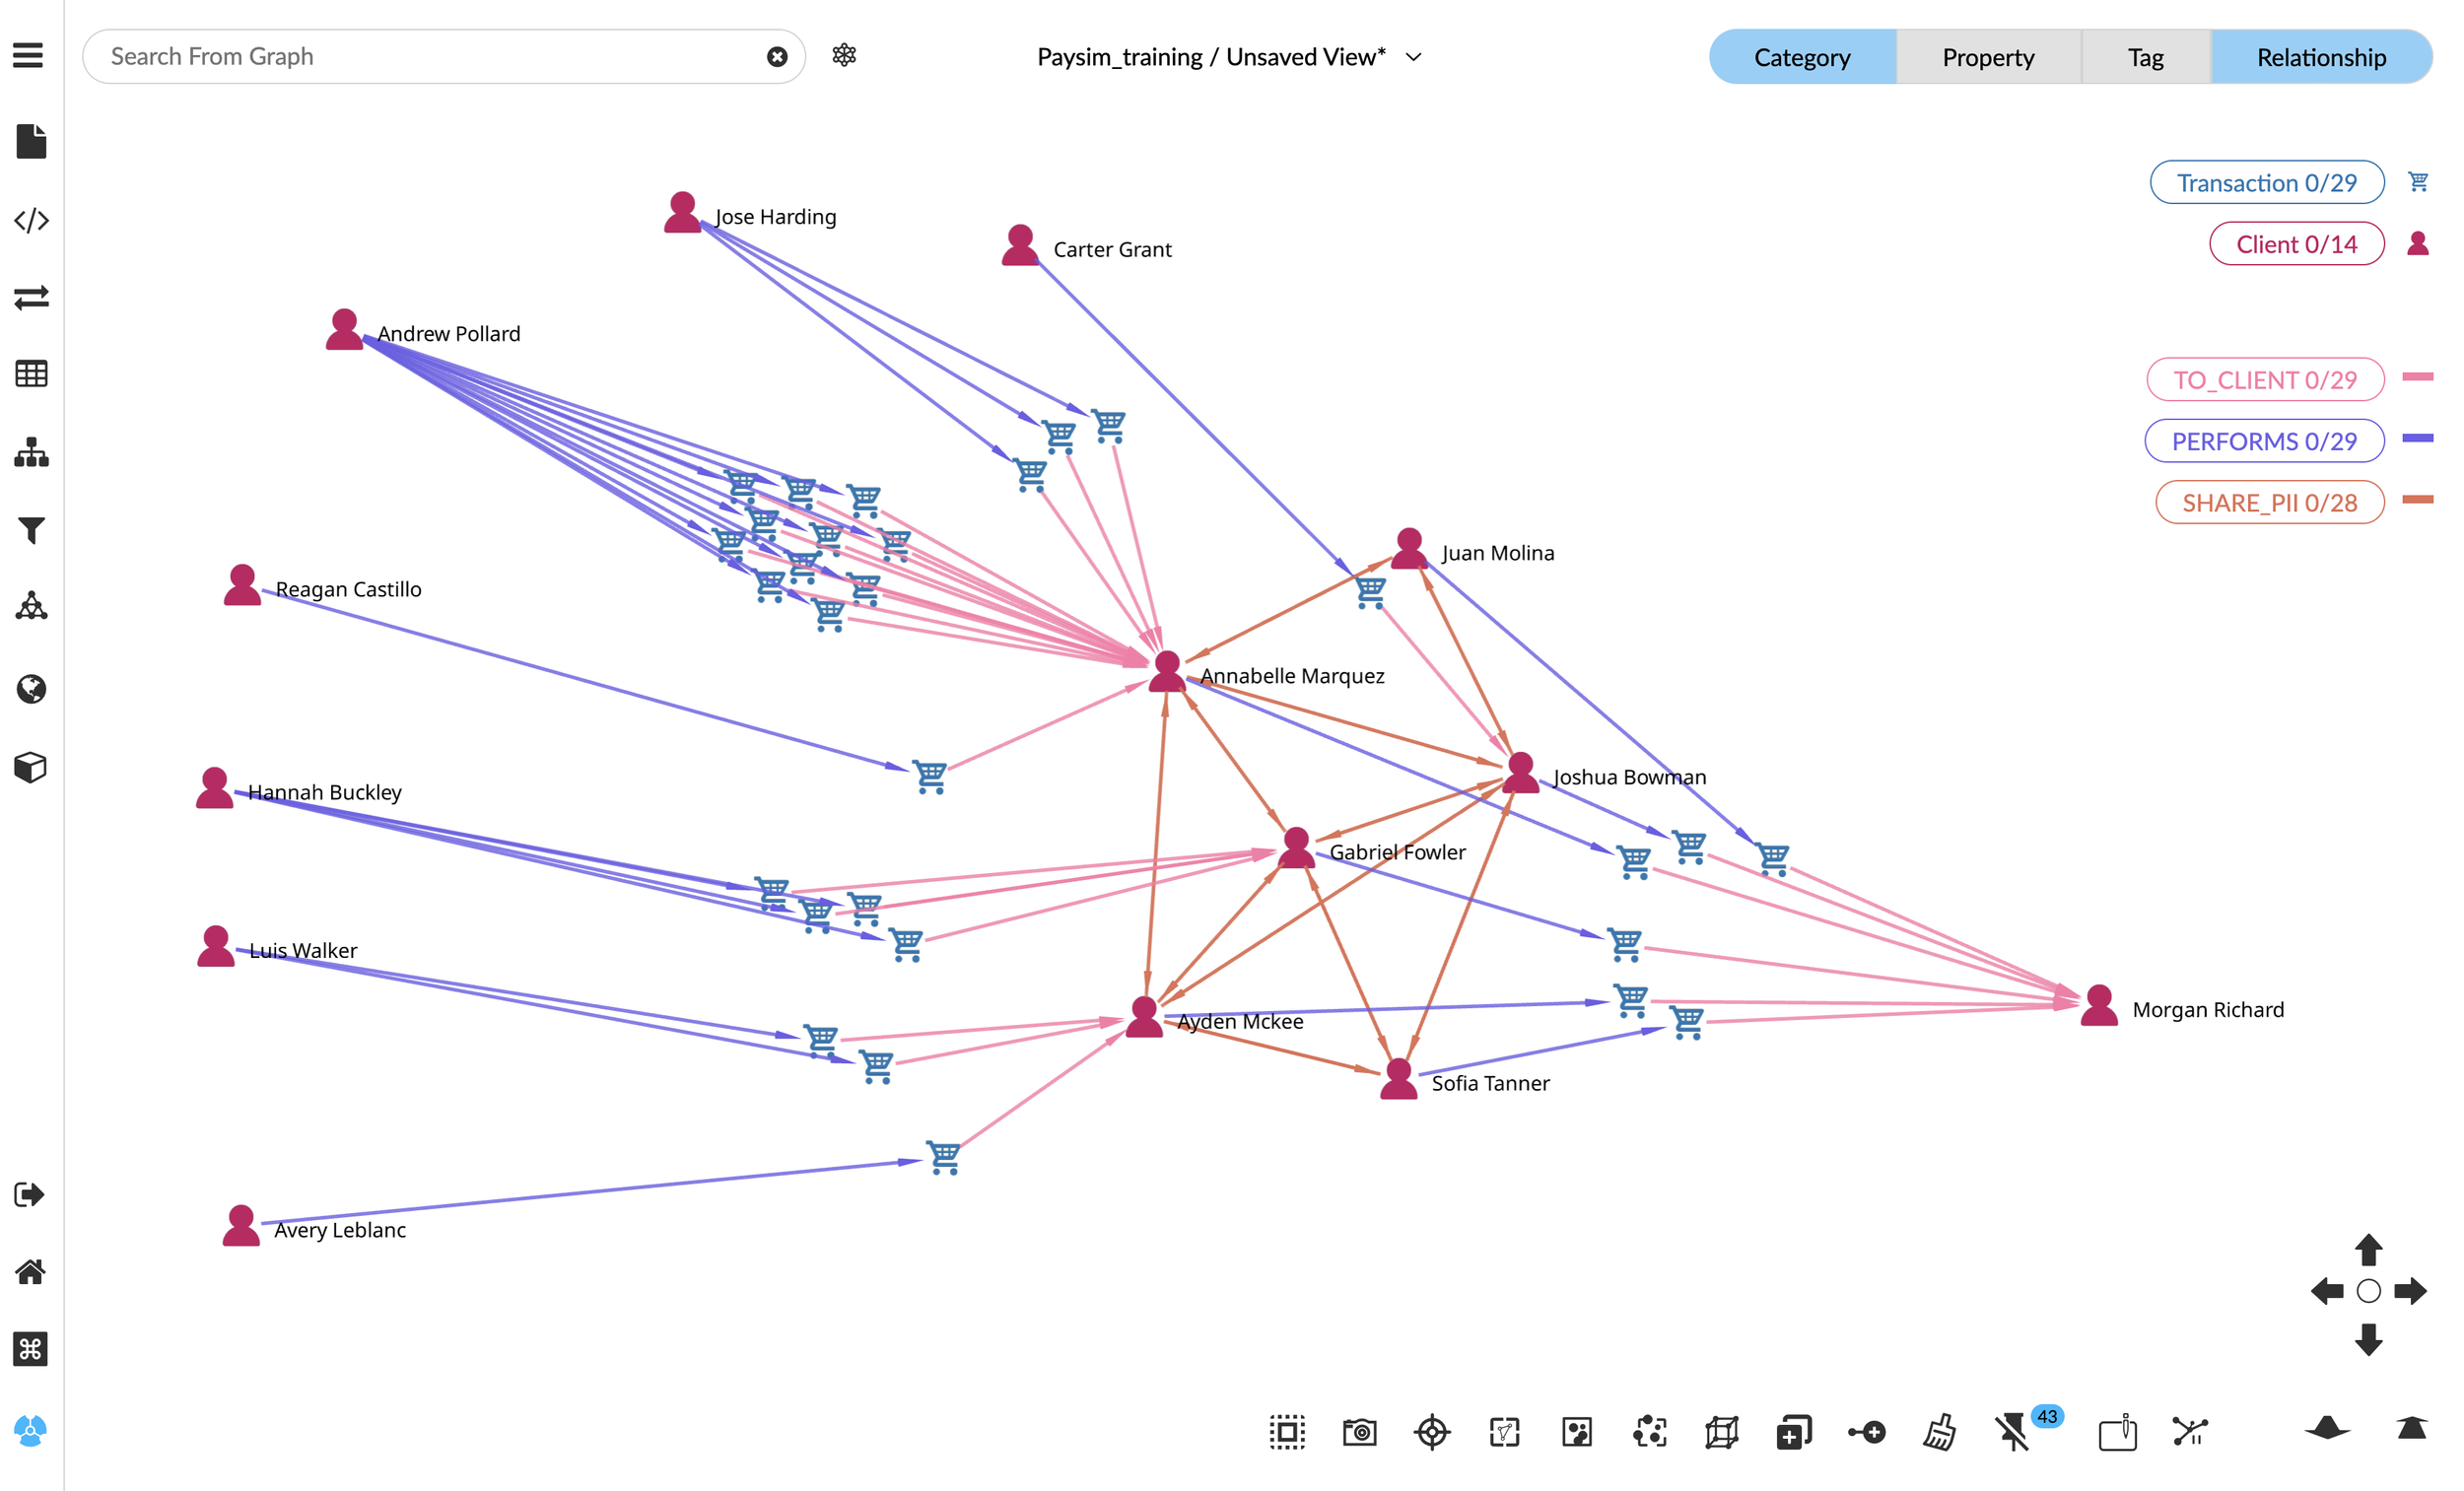
Financial Fraud Detection at Scale: Visual Graph Analytics with Google Cloud Spanner Graph & Kineviz
Trace a simulated investigation that begins with one shared-PII query and ends in a timeline exposing an escalating mule ring. Google Cloud’s Spanner Graph reveals these links—zero ETL—while Kineviz turns them into an interactive network.
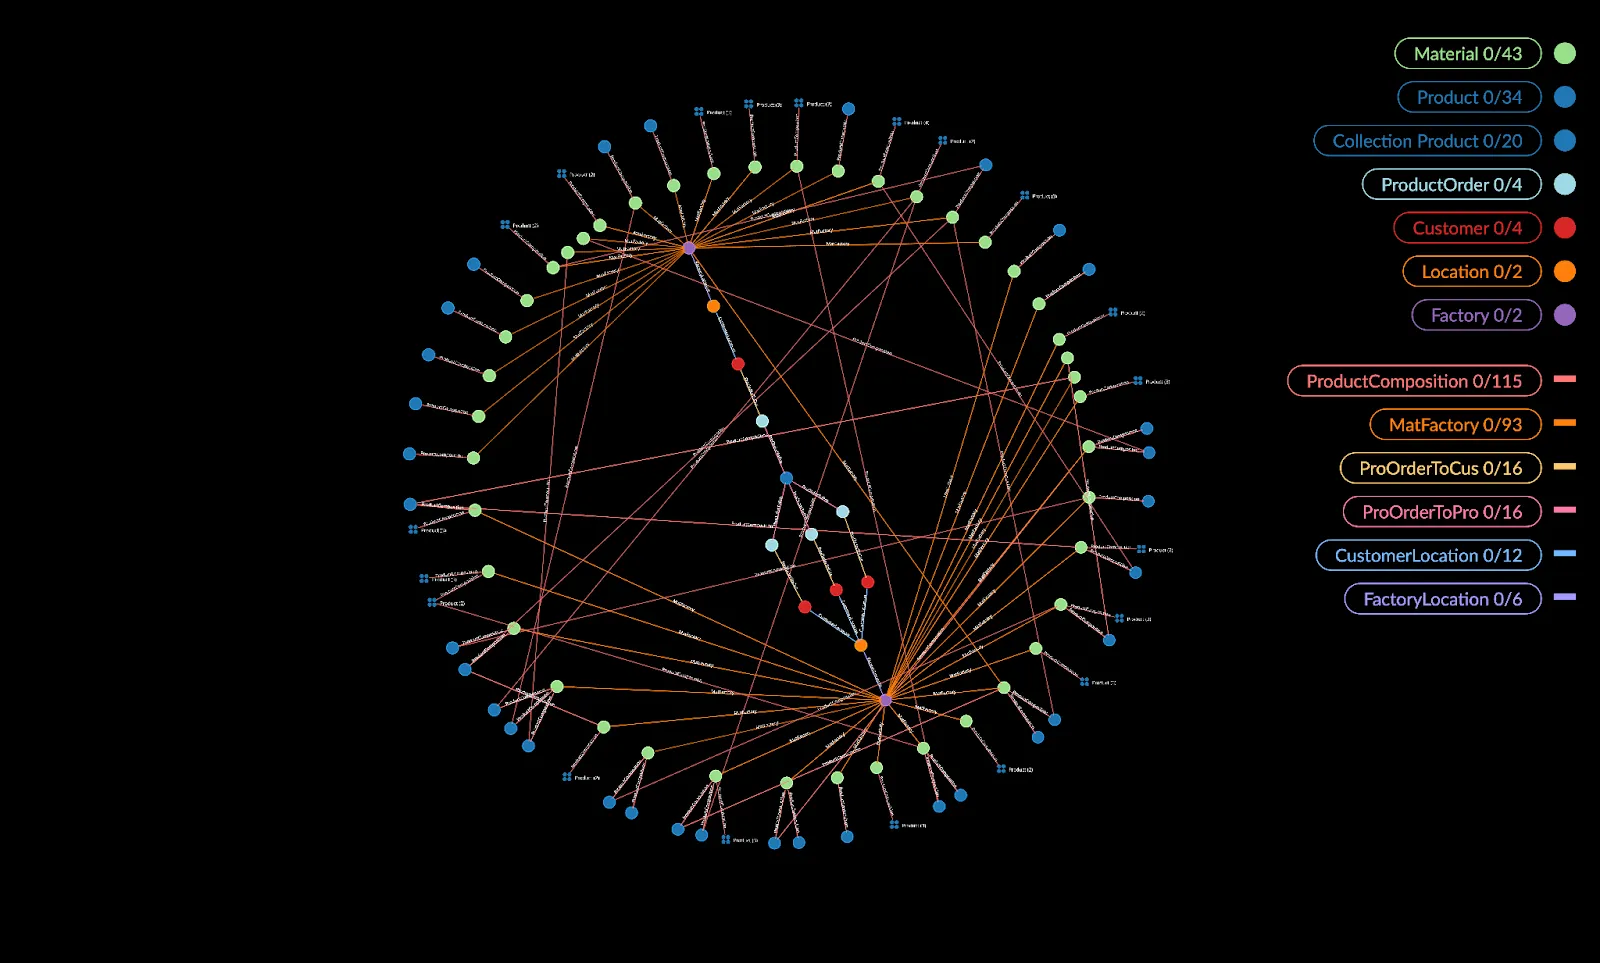
Accelerating Supply Chain Insights with Puppygraph & Kineviz
PuppyGraph’s high-performance query engine transforms relational data into a graph in under 10 minutes—no need for a graph database. When combined with Kineviz’s advanced visualization and analytics, this powerful collaboration unlocks rapid insights, enabling faster decision-making and deeper exploration of your data.
Kineviz Enhances Graph Analytics with Google Cloud’s Spanner Graph
We’re proud to announce a strategic collaboration with Google Cloud to integrate the Kineviz platform with Spanner Graph. This integration combines the scalability and reliability of Spanner Graph with the interactive visualization and advanced analytics of Kineviz.
Exploring the Bipartisan House Task Force Report on AI in SightXR
SightXR explores a lengthy Bipartisan House Task Force Report on AI. Through interactive data visualization, it highlights the energy sector’s regulatory implications while automatically generating summaries, answers, and citations—making it easy to dive deeper into the content and explore new questions.
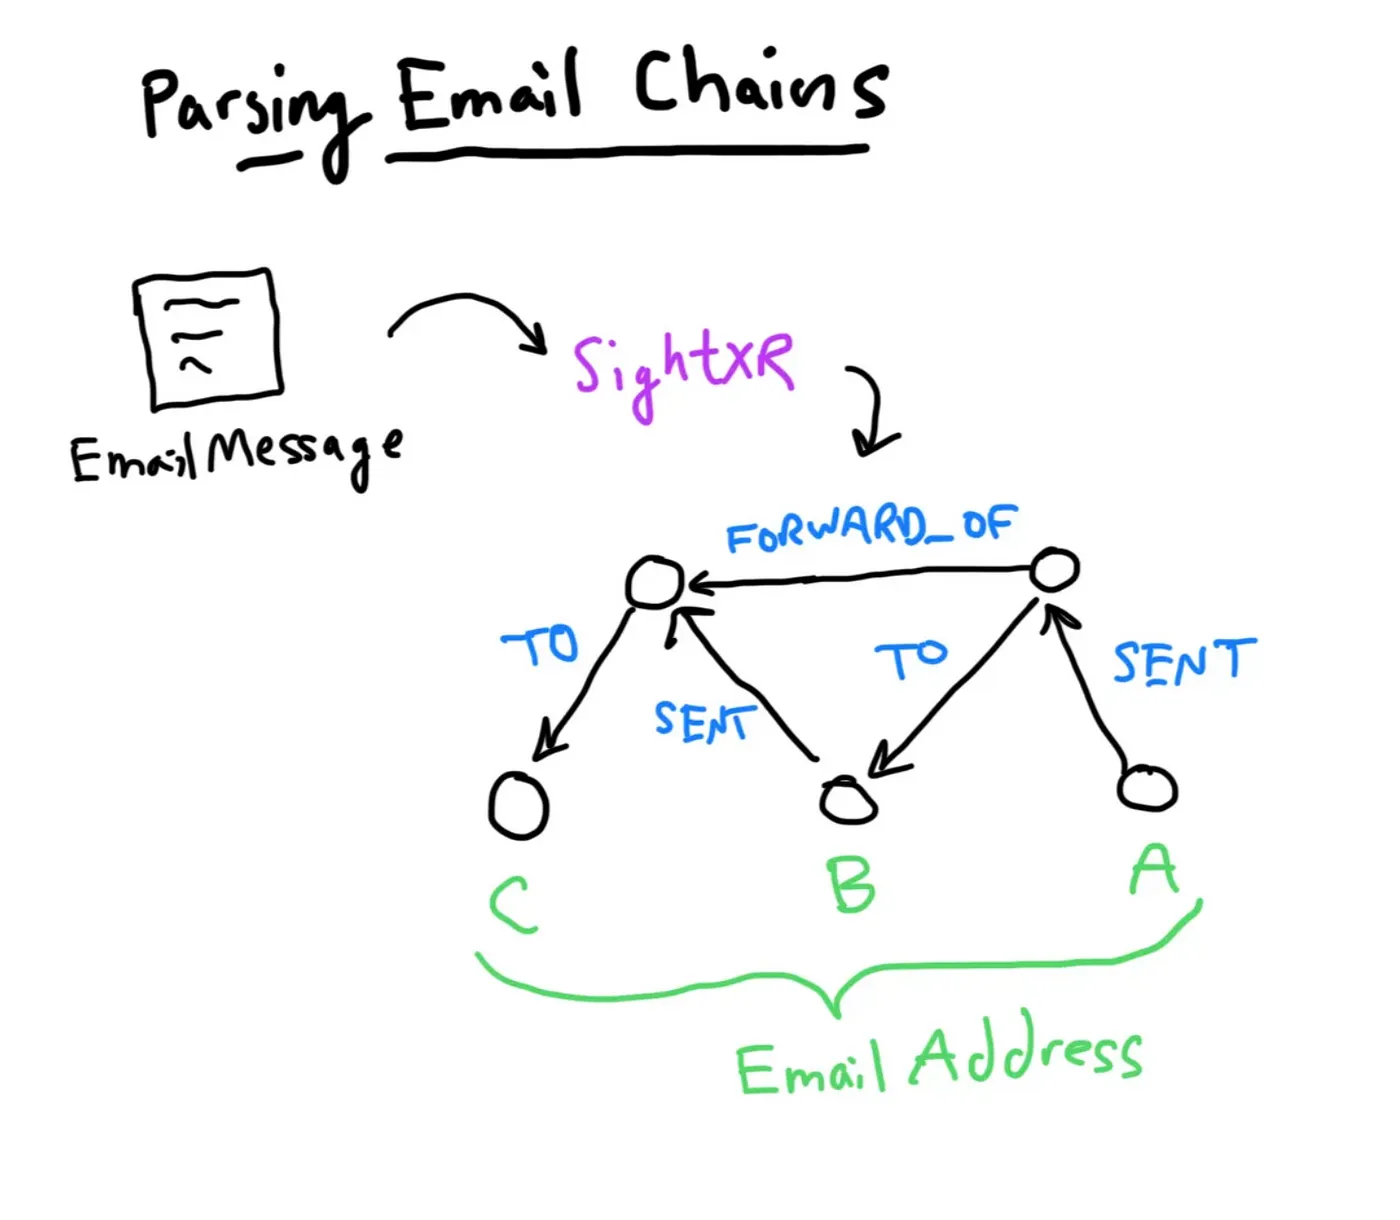
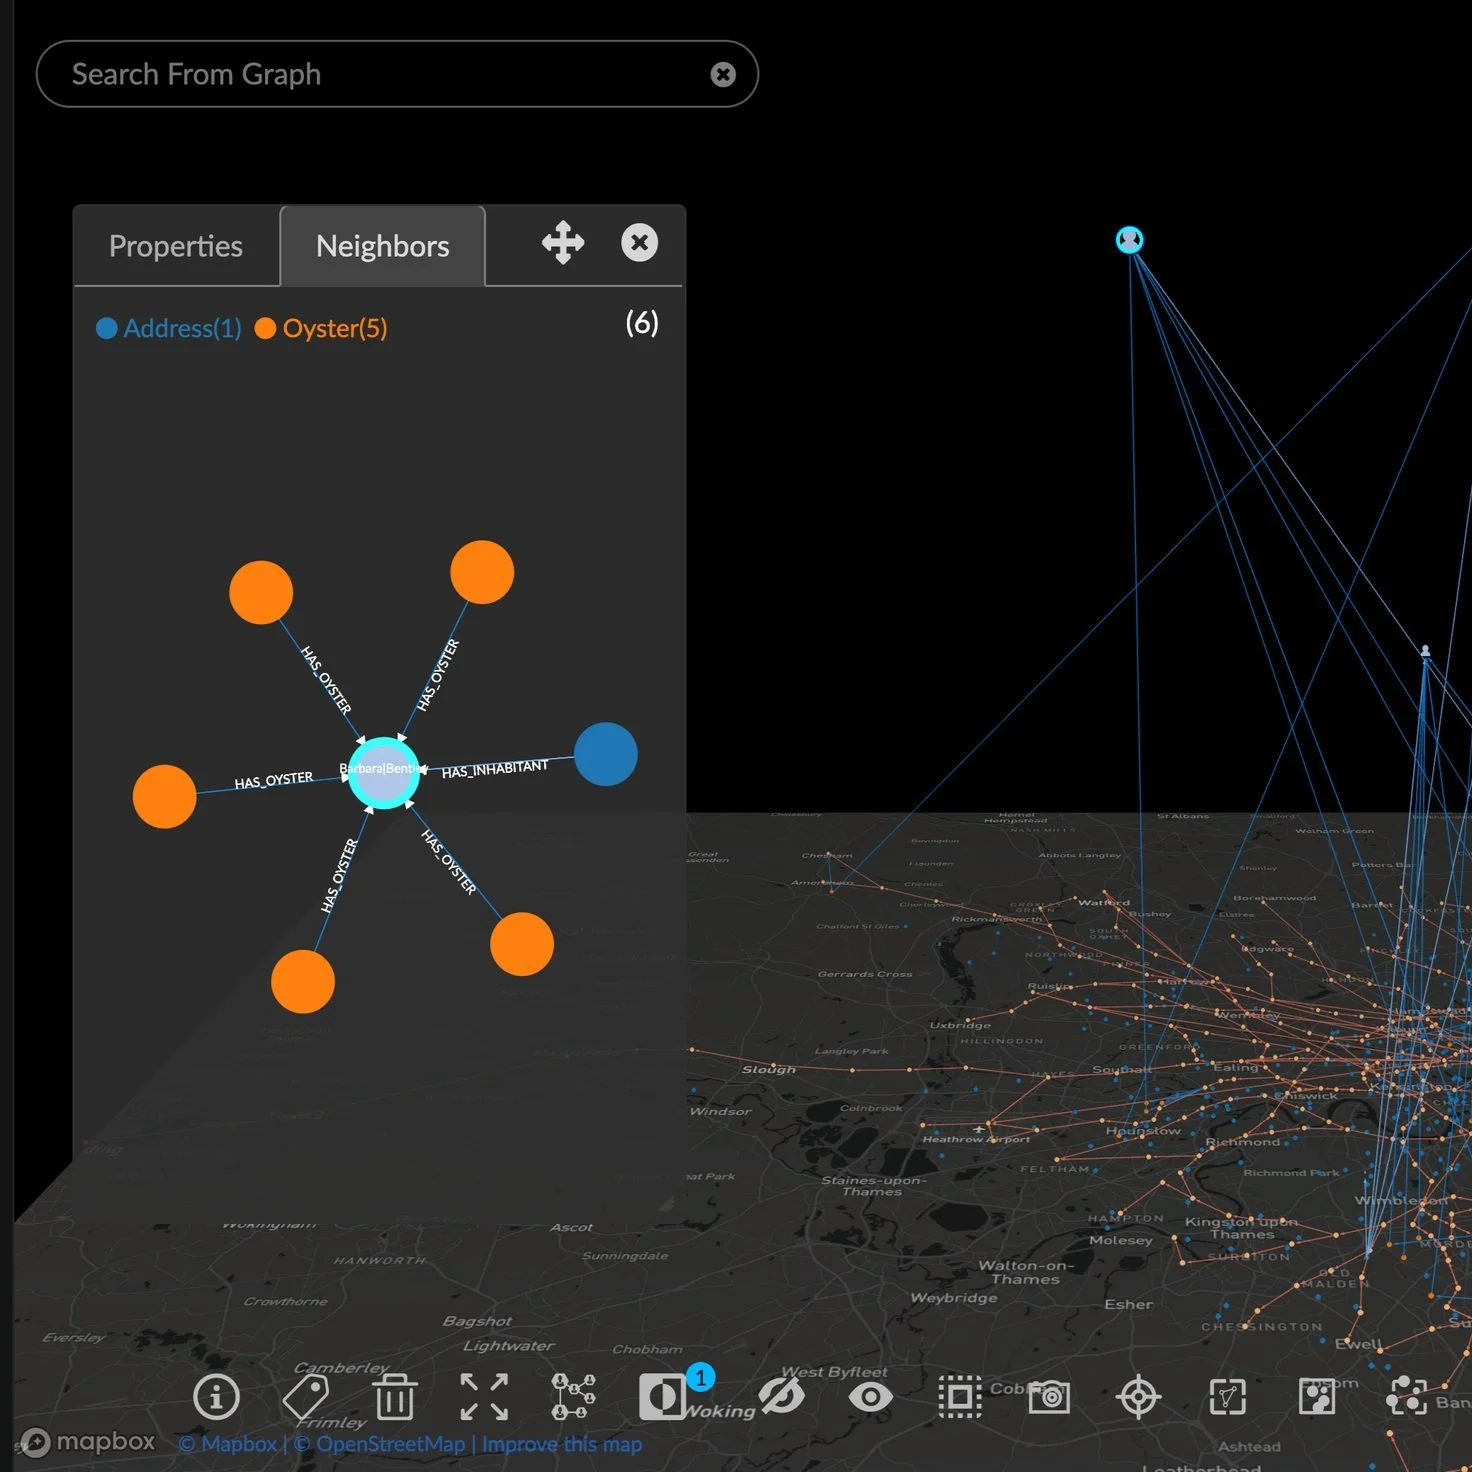
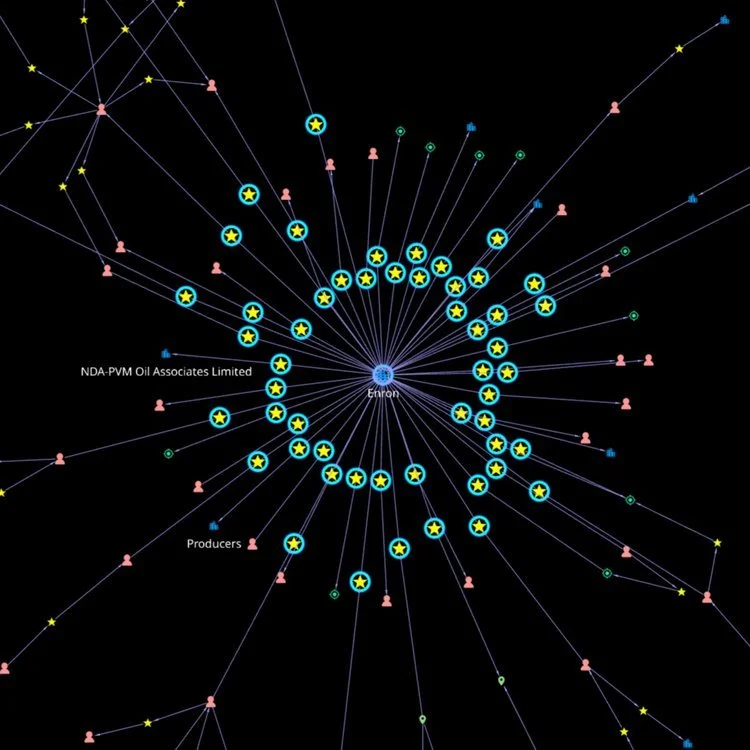
How to create a Knowledge Map from 500k email messages using LLM
In this post, we’ll show how we generated an explainable, interactive knowledge map from 500,000 publicly available email messages in under 12 hours.
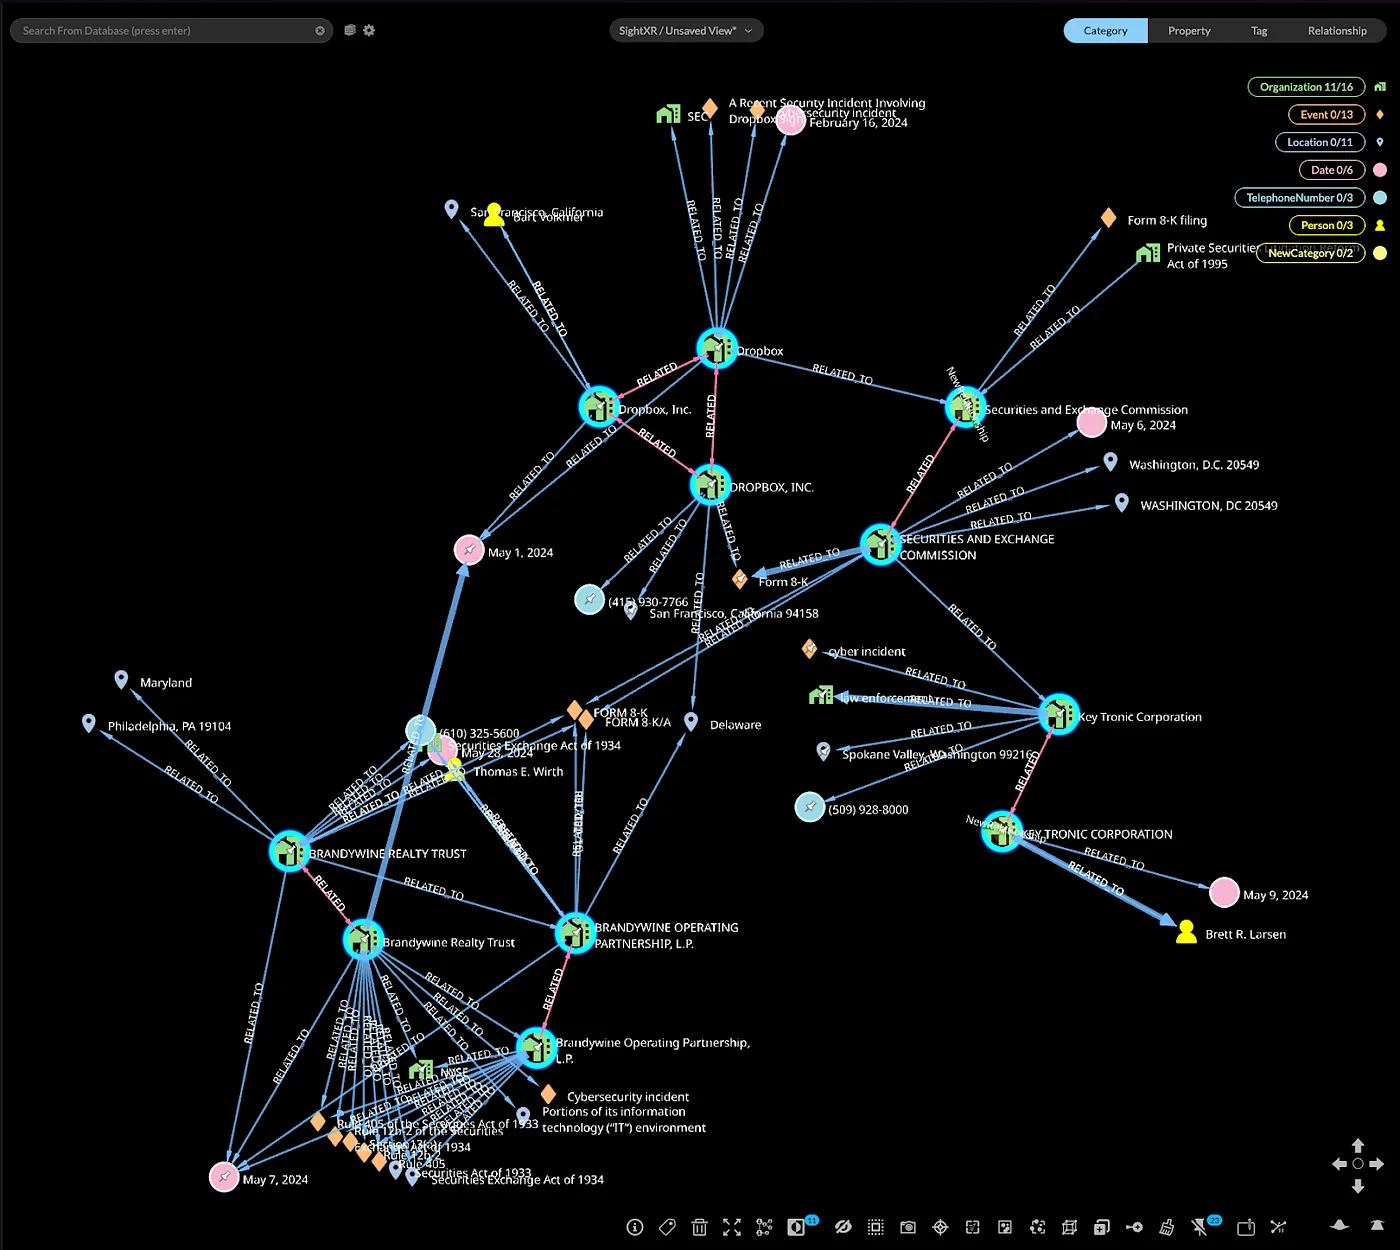
Exploring SEC Filings with SightXR & Senzing
Discover how integrating Streamlit, SightXR, and Senzing can rapidly explore information within SEC filings, spotlighting cybersecurity incidents and their impacts on public companies.
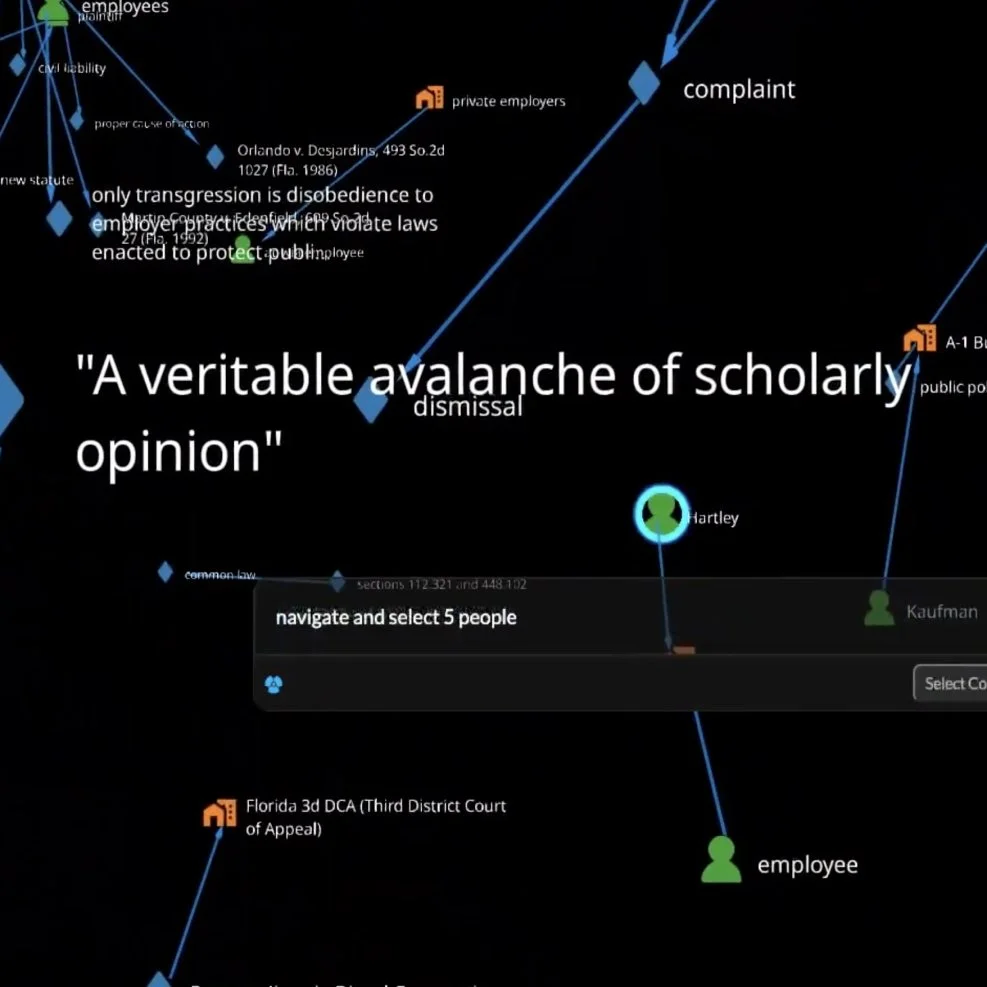
Navigate and Present 3D Graphs with Natural Language Commands
AI can tell, but can it show? Follow along with AI Engineer, Diénert Vieira, as he experiments with a chat interface for navigating a complex graph visualization.
SightXR: Visualization-First Analysis for AI
SightXR provides a visual knowledge map to navigate through large volumes of text, offering clear, concise insights where traditional text summaries fall short.

Harod Analysis and Kineviz announce SeekerXR
SeekerXR lets investigators trace assets, investigate corruption, identify threats and risks, and much more.
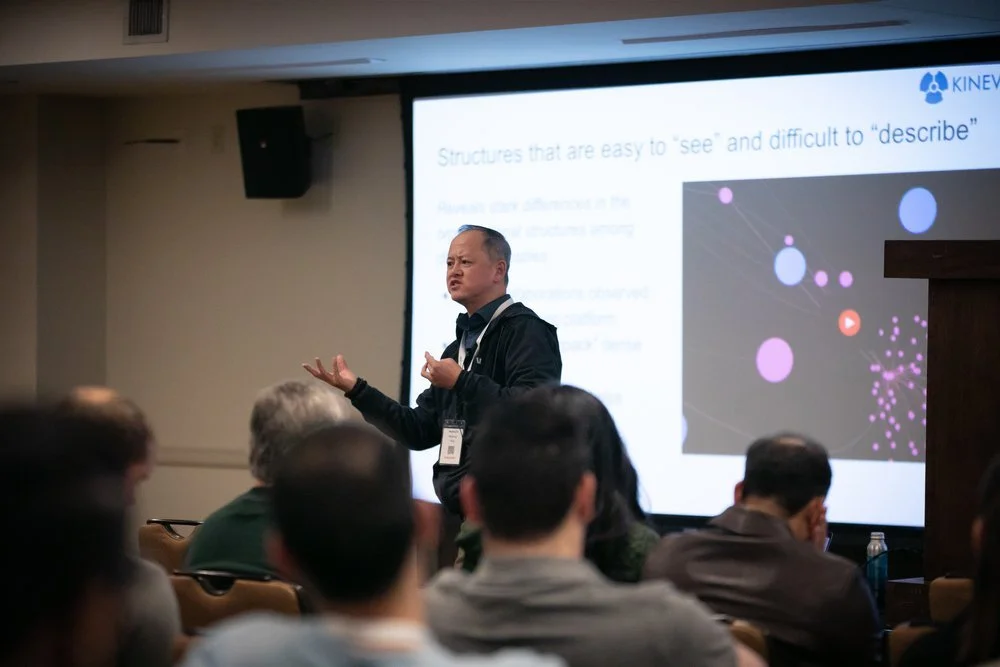
Visualizing Emerging Patterns in Big Data for Proactive Threat Response
Follow Weidong Yang as he introduces a tiered architecture that integrates real-time data with graph-based threat detection.
AI-Powered Knowledge Maps for Navigating Unstructured Data
In our latest blog post we explore how LLMs and graphs working together can be used to generate Knowledge Maps.
Visual Analyst’s Playbook
Learn how Kineviz can enable geospatial awareness and improve investigations through visualization-first analytics (i.e. through search & expand, quick layouts, and more.)
Immersive Data Visualization for Remote Collaboration in Law Enforcement
As part of Project INFINITY in EU's Horizon 2020, Kineviz elevates law enforcement analytics through a multiplayer VR environment, fostering remote collaboration.
Frequently Asked Questions
What is GraphXR Explorer for BigQuery?
GraphXR Explorer for BigQuery is a new offering that, together with BigQuery AI Functions and BigQuery Graph, gives enterprises a streamlined way to turn unstructured data — PDFs, emails, regulatory filings — into explorable, visual knowledge graphs without complex ETL pipelines or separate graph databases. Analysts can visually verify relationships, trace insights back to source documents, and answer complex questions interactively in a single workflow.
What is SightXR?
SightXR was Kineviz's visualization-first analysis tool for AI, providing a visual knowledge map to navigate large volumes of text where traditional summaries fall short. The product has since been discontinued, and its capabilities are now part of the Kineviz platform. Kineviz used SightXR to explore SEC filings with Senzing and to analyze the Bipartisan House Task Force Report on AI, automatically generating summaries, answers, and citations that made it easy to dive deeper into documents.
How does Kineviz work with Google Cloud Spanner Graph?
Kineviz has a strategic collaboration with Google Cloud that integrates the Kineviz platform with Spanner Graph, combining Spanner Graph's scalability and reliability with Kineviz's interactive visualization and advanced analytics. Published workflows include financial fraud detection at scale — tracing a mule ring from a single shared-PII query with zero ETL — and visual telco analysis for communication service providers.
How can you create a knowledge graph from unstructured data using LLMs?
Kineviz has shown that LLMs and graphs working together can generate explainable, interactive Knowledge Maps from unstructured data — in one case building a knowledge map from 500,000 publicly available email messages in under 12 hours. Their approach helps investigators and analysts find grounded answers in documents without relying solely on AI-generated conclusions, keeping humans in the loop.
Can graph visualization be used for fraud detection and cybersecurity?
Yes — Kineviz publishes ongoing work on visual graph analytics for financial fraud detection and cyber threats. Examples include a Spanner Graph investigation exposing an escalating mule ring, an analysis of infostealer malware risk across employee-driven and user-driven infections, and a tiered architecture integrating real-time data with graph-based threat detection for proactive response.
What is Graph Composer from Kineviz?
Graph Composer is a no-code component of Kineviz that maps disparate data sources into a graph model with zero coding. It was introduced by Kineviz COO Sony Green in an ODSC Graph Chat on the evolution of graph intelligence, alongside discussion of Google's Spanner Graph as a watershed moment and human-centric Knowledge Mapping for investigators.
Where can I read the latest Kineviz news and blog posts?
The Kineviz News page collects the company's latest stories on visual analytics, AI-assisted knowledge graphs, and investigative workflows, with links to full posts on the Kineviz blog. Recent highlights include GraphXR Explorer for BigQuery, Spanner Graph collaborations with Google Cloud, SightXR analyses, PuppyGraph supply chain insights, and LLM-generated knowledge maps.