
Anti-fraud
Investigate evolving fraud schemes and gain actionable insights with a visualization-first approach.
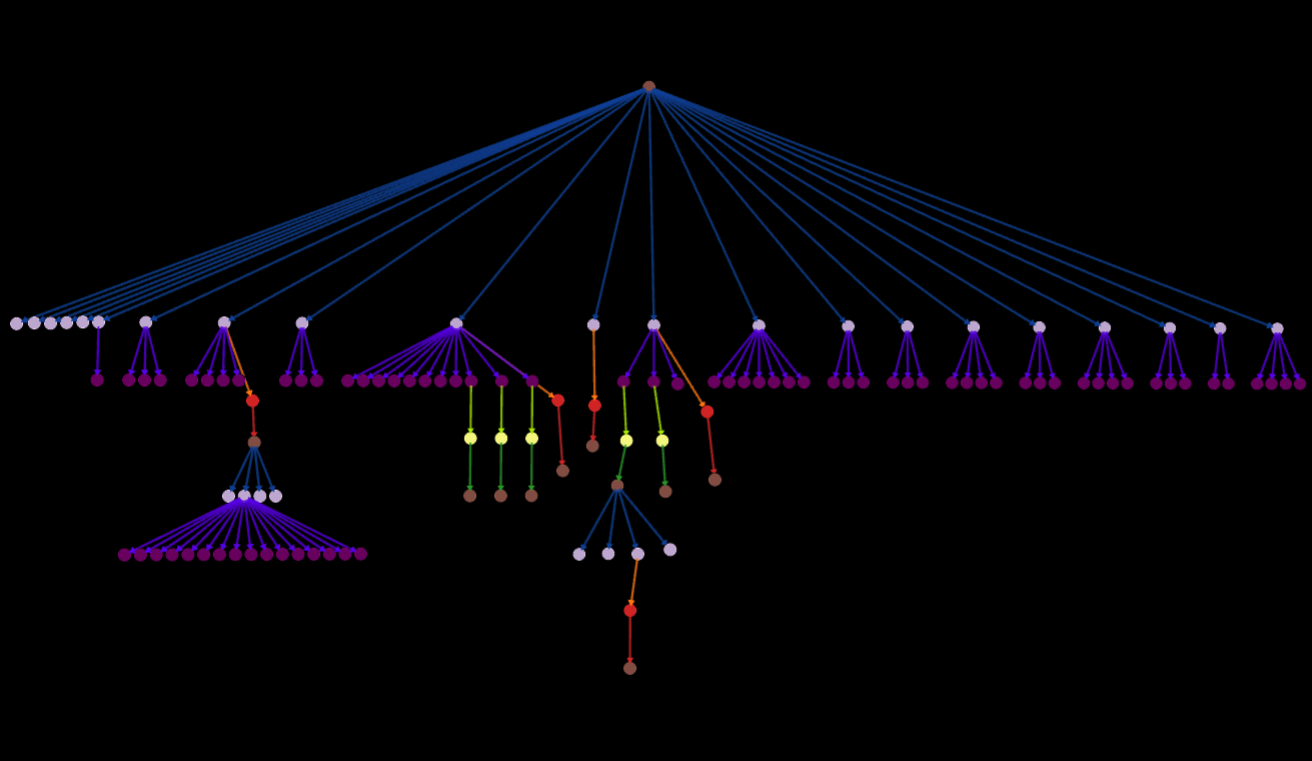
Dive into how fraud analysts empower digital investigations through iterative and customizable workflows.
Connection-driven intelligence
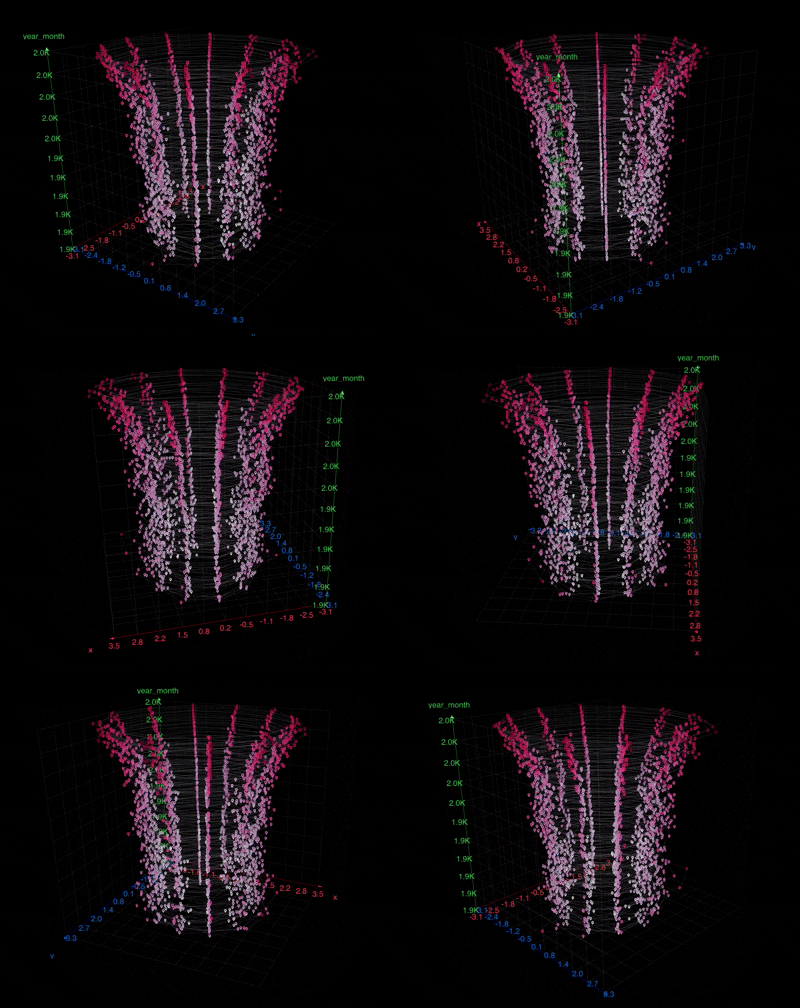
Intelligence-based workflow
Turn structured and unstructured data into a connected system AI can reason over. Kineviz combines intuitive workflows with high-dimensional graph visualization, allowing analysts to explore relationships instead of isolated records. AI-generated structure helps surface what matters, while interactive filtering removes noise—accelerating iteration and making insights traceable, explainable, and ready for decisions.
Connection-driven data model
Analysts work within a connection-driven data model built for reasoning across relationships. This graph schema doesn’t just enable traversal—it gives AI and humans a shared structure for investigation. Entities, links, and inferred connections become part of a navigable system, making it faster to uncover hidden patterns, validate findings, and move from signals to evidence-backed conclusions.
Visualisation-first approach
Kineviz accelerates fraud detection with a visualization-first reasoning environment. Seamless integration—combined with no-code Cypher querying—lets analysts see how AI-derived insights connect across the graph. Instead of black-box outputs, users explore relationships visually, trace them to source data, and refine hypotheses in real time for faster, more trustworthy fraud prevention.
Exposing Collusion in the Gaming Industry
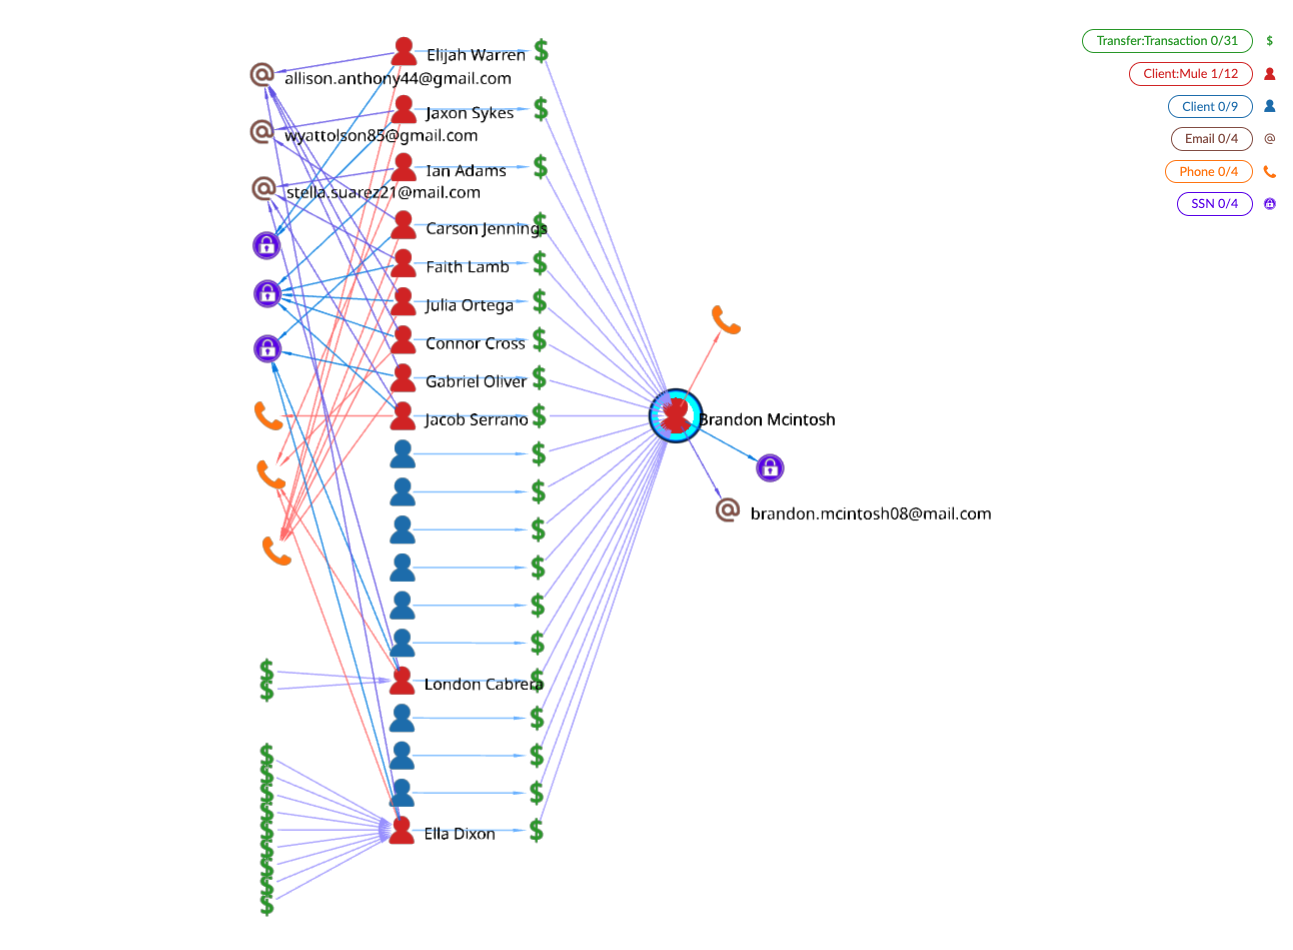
Detecting and responding to collusion is a difficult and time-consuming process. A horse racing organization's trust and integrity team uses Kineviz to intuitively address these challenges, accelerating investigations for sports betting integrity.
Frequently Asked Questions
How does graph analytics help with fraud detection?
Graph analytics detects fraud by mapping entities—accounts, transactions, identities—as connected relationships instead of isolated records, making coordinated schemes visible. Kineviz GraphXR applies this with a visualization-first approach: analysts explore relationships in multi-dimensional graph views, use interactive filtering to remove noise, and trace AI-derived insights back to source data — the AI augments the analyst's field of view; the analyst still draws the conclusions — producing conclusions that are explainable, auditable, and evidence-backed rather than black-box outputs. When a case needs outside context, SeekerXR brings in open-source intelligence from 80+ OSINT and proprietary sources.
Why use a graph database for fraud detection instead of traditional tools?
Graph databases store data as entities and relationships, so multi-hop connections that reveal fraud rings stay intact instead of being flattened into rows and joins. Kineviz builds on this with a connection-driven data model: entities, links, and inferred connections form a navigable system that both AI and human analysts can reason over, making it faster to uncover hidden patterns and validate findings.
What is link analysis in fraud investigation?
Link analysis is the technique of visualizing connections between people, accounts, and events to expose relationships that indicate coordinated fraud. In Kineviz, analysts perform link analysis in an interactive graph environment with no-code Cypher querying, exploring how signals connect across the graph, refining hypotheses in real time, and moving from suspicious signals to evidence-backed conclusions.
How do investigators detect fraud rings and collusion with network visualization?
Investigators detect fraud rings by visualizing shared attributes and connections that link seemingly unrelated actors into one coordinated network — and Kineviz's built-in community detection, centrality, and shortest-path algorithms surface those clusters automatically. A real-world example from Kineviz: a horse racing organization's trust and integrity team uses the platform to detect and respond to collusion in sports betting, turning a difficult, time-consuming process into faster, more intuitive investigations.
Can AI be used for fraud detection, and how do you trust its output?
Yes—and the right role for AI is amplifying investigators, not replacing them: it accelerates fraud detection, but trustworthy results require transparency, not black-box scores. Kineviz turns structured and unstructured data into a connected system AI can reason over; AI-generated structure surfaces what matters, while analysts visually explore the relationships behind each insight and trace them to source data, keeping conclusions traceable, explainable, auditable, and ready for decisions.
What does a fraud analyst's investigation workflow look like in a graph tool?
A graph-based fraud workflow is iterative: connect data, visualize relationships, filter noise, test hypotheses, and document evidence. Kineviz supports this with intelligence-based workflows that are iterative and customizable—analysts combine intuitive interfaces with multi-dimensional graph visualization and interactive filtering, accelerating iteration from initial signals to validated, decision-ready findings.
Do fraud analysts need to know a query language to use graph visualization software?
No—Kineviz supports no-code Cypher querying, so analysts can query the graph without writing query-language syntax. Combined with seamless data integration and visual exploration, this lets fraud teams see how AI-derived insights connect across the graph and drill into relationships directly, rather than depending on engineers to translate every investigative question into code.