
Healthcare
& Life Sciences
Harnessing rapid visualization techniques for complex data in clinical trials, 3D imaging, and healthcare innovation.
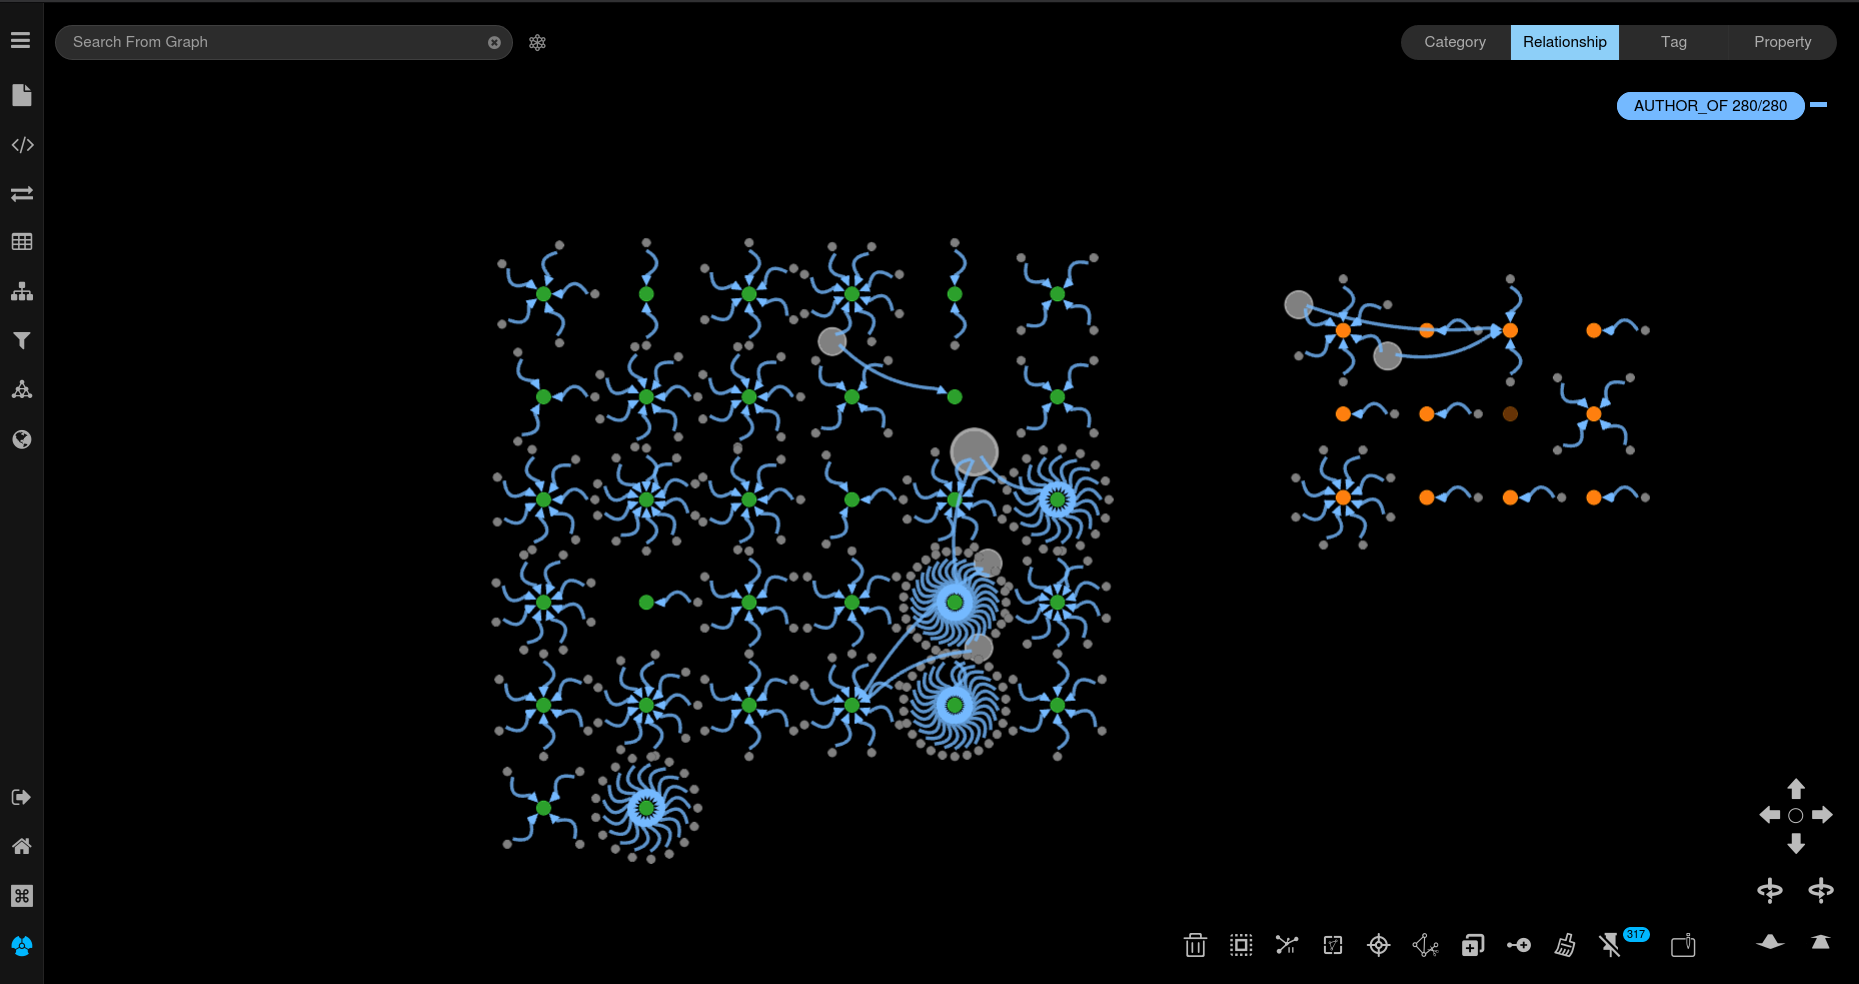
From Patient Journey Mapping to Advanced 3D Imaging
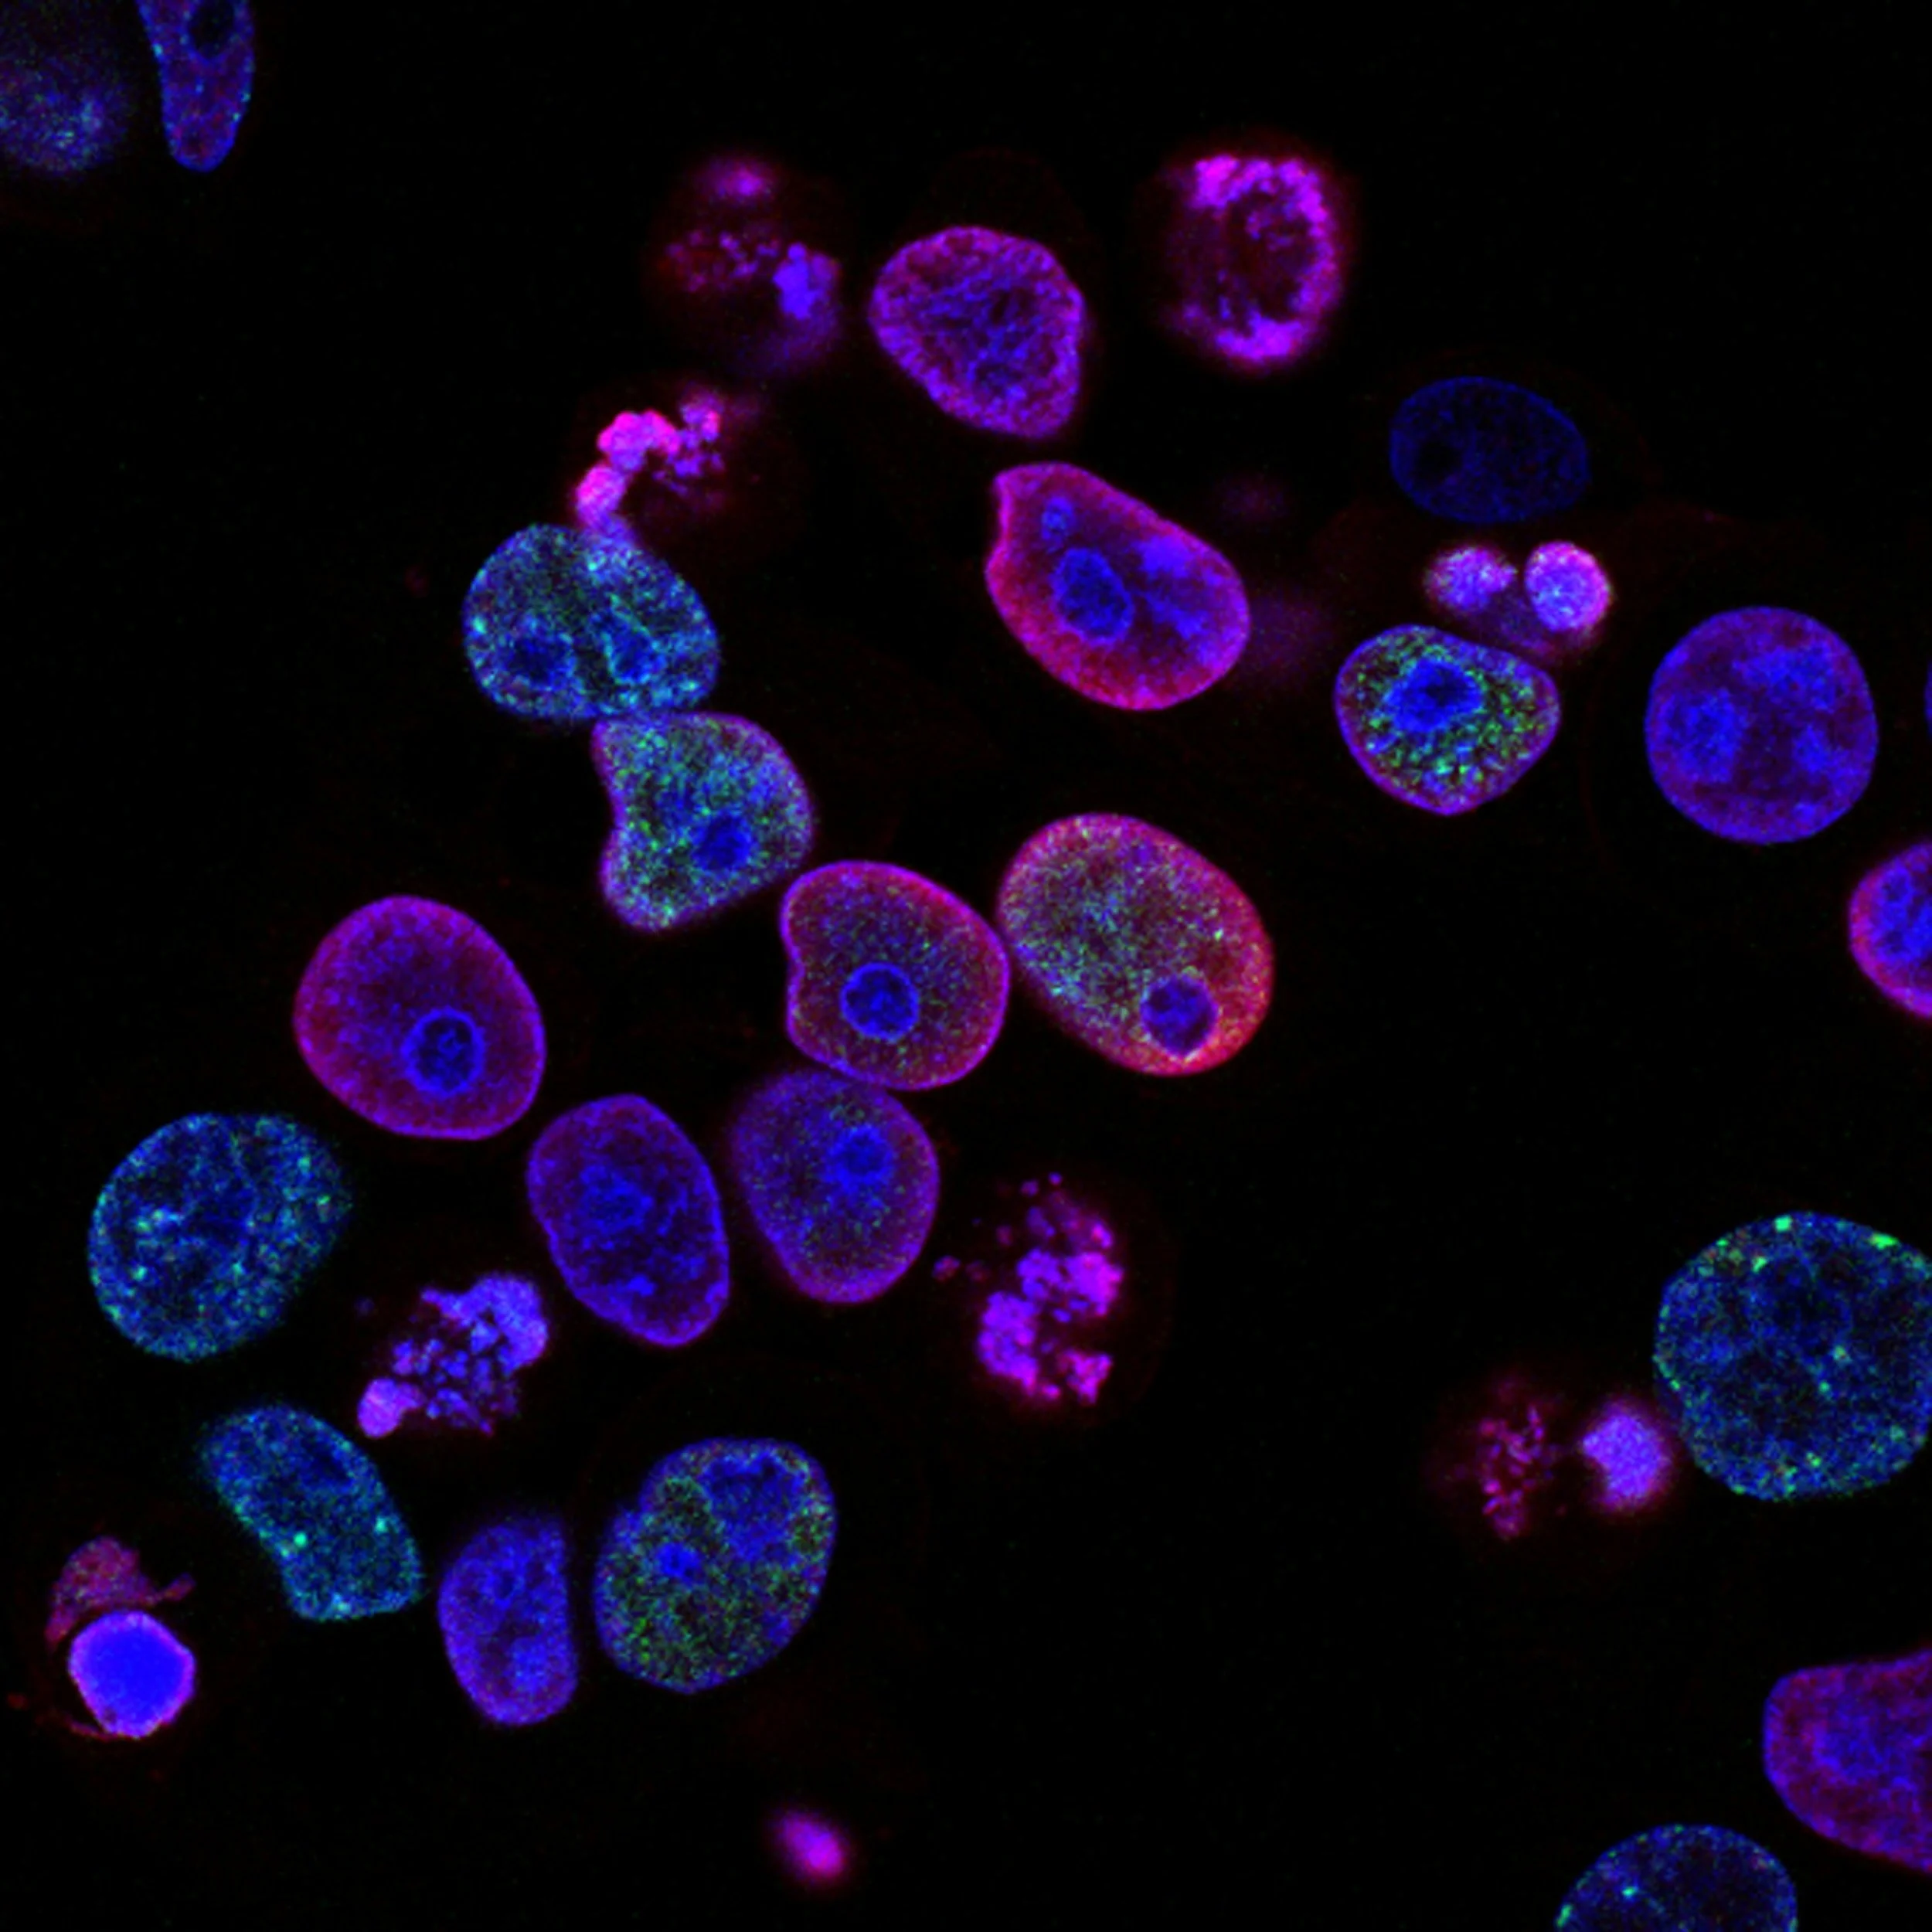
Representing Imaging Data
Turn imaging data into a connected system AI can reason over. Kineviz exposes temporal and topological attributes of progressive diseases by linking MRI findings, patient context, and derived features into a navigable graph. Researchers don’t just compare scans—they explore how changes relate over time, resolve ambiguities, and communicate evidence-backed insights clearly across teams, clinicians, and patients.
Tracking Novel Markers
Connect peer-reviewed medical literature, experimental data, and observations into a unified knowledge graph. AI helps extract entities and relationships from publications, while the high-dimensional view reveals emerging patterns that would remain hidden in isolated tables. Researchers can collaboratively navigate this knowledge base, trace novel markers to their sources and accelerate new discoveries with transparent, relationship-driven analysis.
Frequently Asked Questions
What is a knowledge graph in healthcare and life sciences?
A healthcare knowledge graph connects entities like diseases, treatments, markers, and publications into a network of relationships that researchers and AI can reason over. Kineviz builds unified knowledge graphs from peer-reviewed medical literature, experimental data, and observations, with AI extracting entities and relationships from publications so teams can navigate the evidence base collaboratively.
How are knowledge graphs used in biomedical research and discovery?
Knowledge graphs accelerate biomedical discovery by revealing relationships across literature, experiments, and observations that stay hidden in isolated tables. With Kineviz, researchers track novel markers in a multi-dimensional graph view that surfaces emerging patterns, trace each marker back to its source publications, and accelerate discoveries through transparent, relationship-driven analysis.
What is patient journey mapping and how is it visualized?
Patient journey mapping visualizes a patient's experiences and clinical events over time so teams can understand progression, context, and outcomes. Kineviz supports workflows spanning patient journey mapping to advanced 3D imaging, using rapid visualization techniques built for the complex data found in clinical trials, imaging studies, and broader healthcare innovation.
How can medical imaging data like MRI scans be analyzed as a graph?
Graph analysis links imaging findings to patient context and derived features, so researchers study how changes relate over time instead of just comparing scans. Kineviz can expose the temporal and topological attributes of progressive diseases by connecting MRI findings into a navigable graph, helping researchers resolve ambiguities and communicate evidence-backed insights to clinicians and patients.
How does AI help build knowledge graphs from medical literature?
AI automates the extraction of entities and relationships from peer-reviewed publications, turning unstructured text into structured, connected knowledge. In Kineviz, those AI-extracted relationships join experimental data and observations in a unified knowledge graph that research teams navigate together—revealing patterns hidden in isolated tables while keeping every finding traceable to its source.
What are the benefits of graph visualization for clinical trial data?
Graph visualization helps clinical teams see relationships across trial data—patients, timepoints, findings, and derived features—rather than rows in separate tables. Kineviz applies rapid visualization techniques to complex clinical trial and imaging data, exposing temporal patterns in disease progression and making results easier to explore, validate, and communicate clearly across teams, clinicians, and patients.
How do research teams collaborate on a shared biomedical knowledge base?
Effective collaboration requires a shared, navigable structure where every claim links back to its evidence. Kineviz provides this as a collaboratively navigable knowledge graph: researchers explore connected literature, experimental data, and observations together, trace novel markers to their sources, and communicate insights clearly across teams—accelerating discovery with transparent, relationship-driven analysis.