Accelerating Supply Chain Insights with Puppygraph & Kineviz
Supply chain data tends to be pushed to its limits when queried within the SQL ecosystem. Specifically, analyzing supply chain data in SQL often requires multiple complex joins and sub-queries. Luckily, there are some types of databases that make navigating this data much more straightforward, namely, graph databases. Unfortunately, the complexity of setting up a graph database for such a use case can be quite a lift.
What if you could get the benefits of a graph database without the overhead? Turns out you can, with a powerful, performant combination of the graph query engine built by Puppygraph , and the enhanced graph visualization and analytics of the Kineviz platform.
Puppygraph is the first and only real-time, zero-ETL graph query engine that transforms relational data into a graph model in under 10 minutes — without the cost, latency, or maintenance of traditional graph databases. It scales to petabytes, runs 10-hop queries in seconds, and eliminates the need for complex ETL processes — like loading relational data into a separate graph database. By letting you query SQL and other relational databases as a graph using Gremlin or Cypher, Puppygraph enables you to traverse data connections with graph query languages for more intuitive, efficient analysis. This approach minimizes performance bottlenecks and empowers faster, more streamlined exploration of supply chain data and the insights hidden within it.
Kineviz offers powerful visualization and analytics that let you extend and enhance the results of Puppygraph queries. Handing off the graph to Kineviz’s interactive platform lets you easily visualize intricate supply chain data, helping technical and non-technical stakeholders understand the relationships among products, factories, materials, locations, customers, and inventory.
Combining these two technologies gives you a clear, shared picture of what’s happening across your supply chain.
Curious to see how the puzzle fits together? Let’s look at some examples of how these two platforms play together.
Moving from Raw Data to Initial Insights
The data within a database is simply that: data. For many kinds of data, a focus on connections and pathways yield the most valuable insights. For supply chain data, as mentioned, one of the best ways to do this is by looking at data as a graph. And from there, you can use graph analysis and algorithms to make sense of the connections.
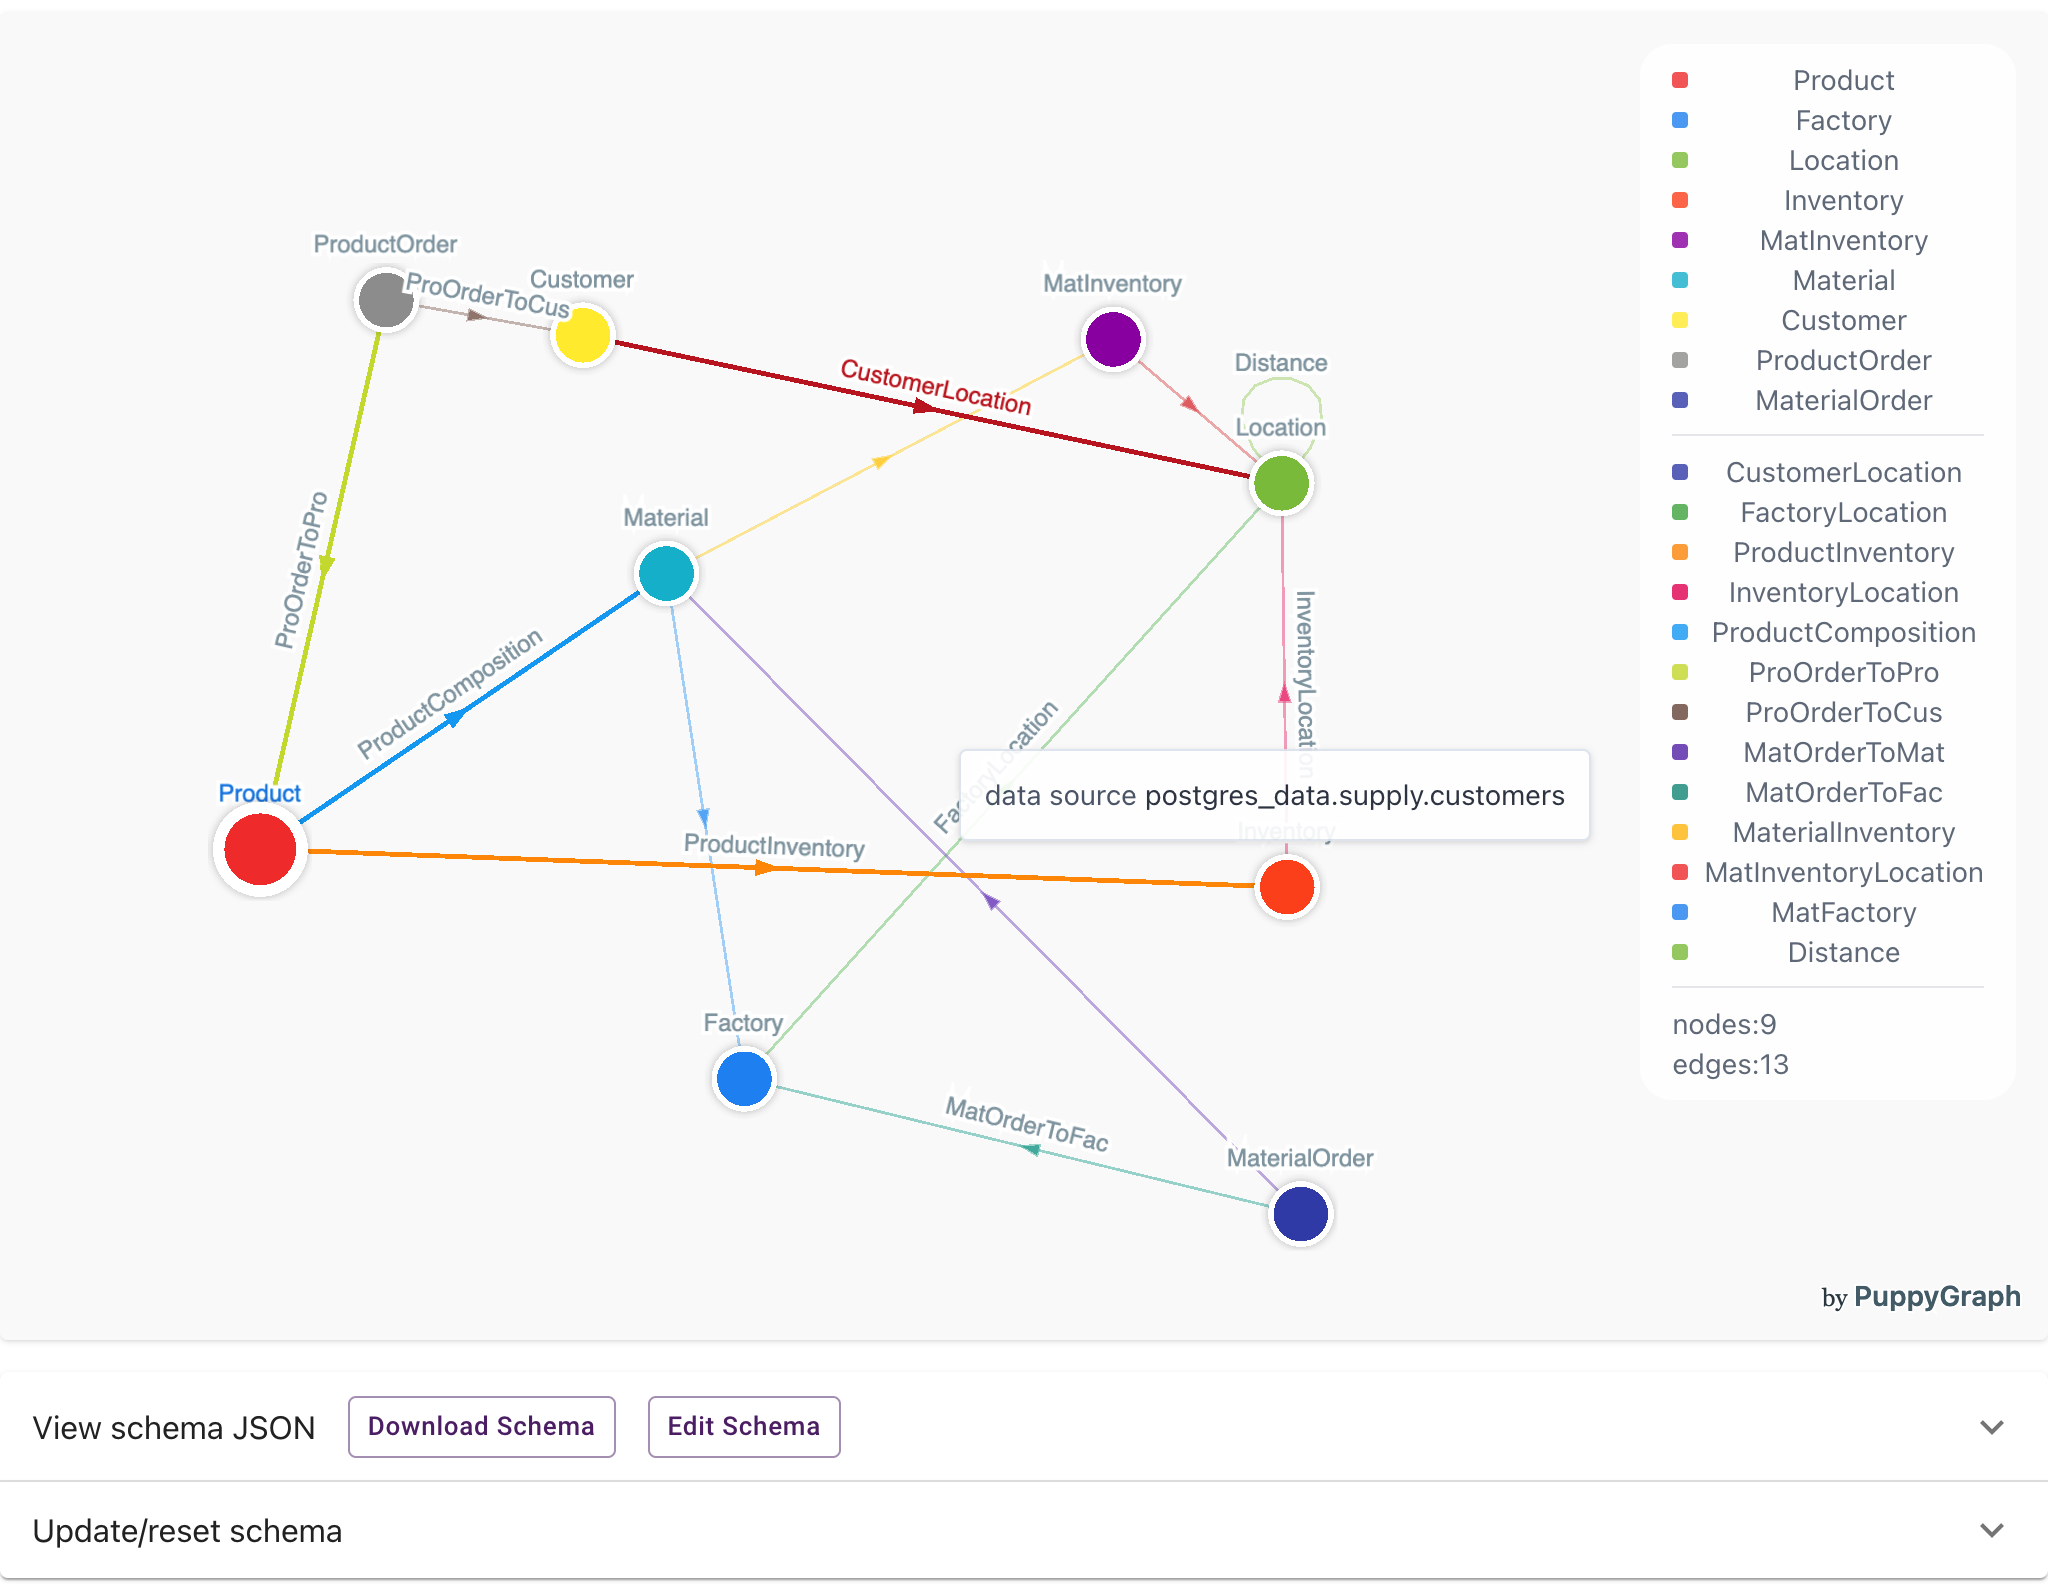
PuppyGraph’s graph query engine lets you define schemas to transform data within your relational data store seamlessly into a graph and display it in an interactive dashboard. You can then pull the data from PuppyGraph into Kineviz for enhanced graph visualization and analysis.
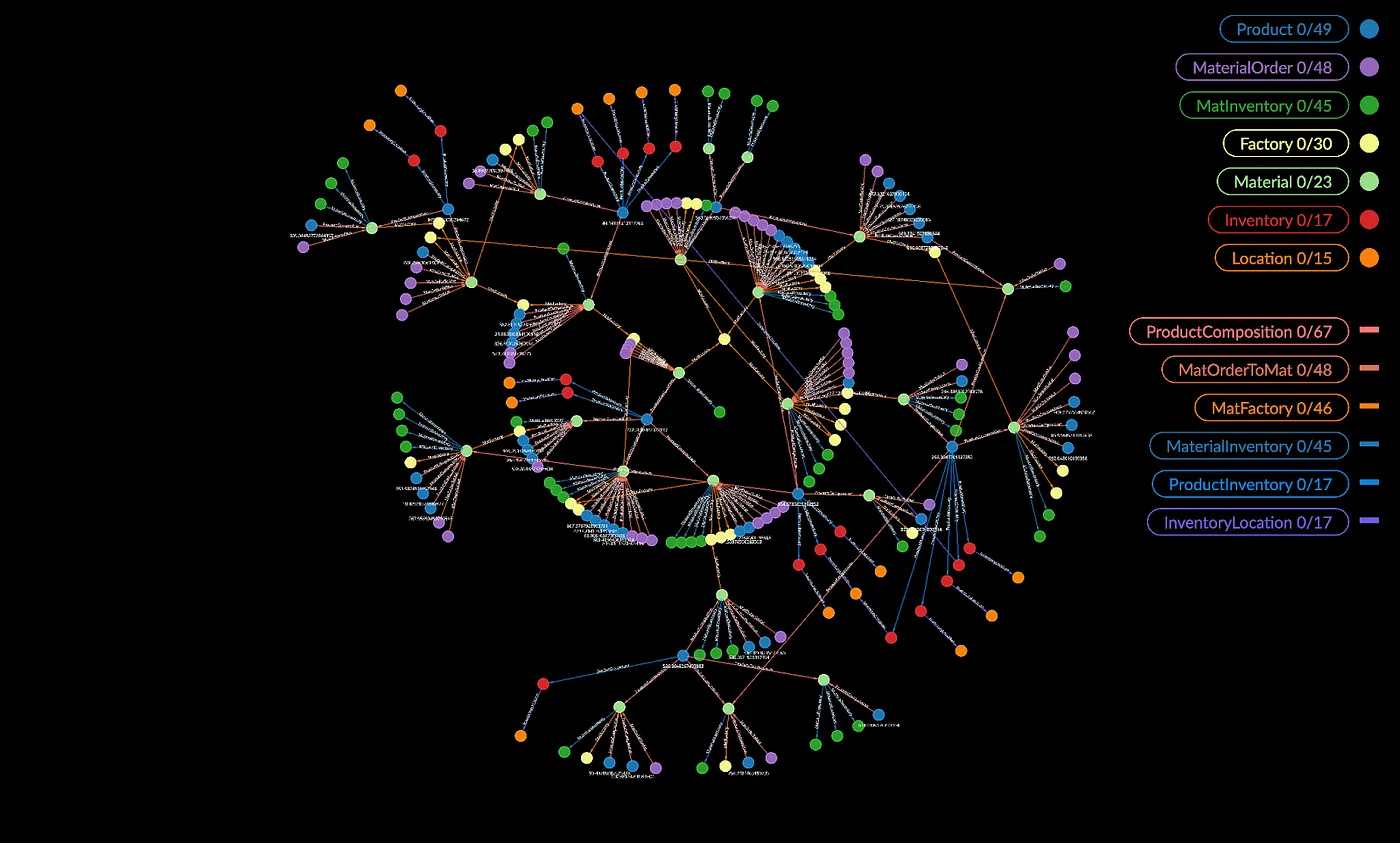
To illustrate how this works, let’s start with a sample supply chain dataset stored in a SQL database that Puppygraph delivers as a graph. After defining a data model or schema that addresses our key entities (Products, Factories, Materials, Locations, Customers, and Inventory), PuppyGraph can be used to query the SQL data and map it into a connected graph. With the data now accessible in a graph format, we can connect to Kineviz through an API.
With Kineviz, it takes just a few clicks to visualize connected customers, product orders, locations, factories, and materials all at once. Now we can pass the following simple Cypher query that will run in PuppyGraph to look up a specific product (Product 14) and check how many units are available:
MATCH (start:Product {productname: ‘Product 14’})-[r1]-(m:Material)-[r2]-(f:Factory)-[r3]-(l:Location)-[r4]-(i:Inventory)-[r5]-(end:Product)
return *
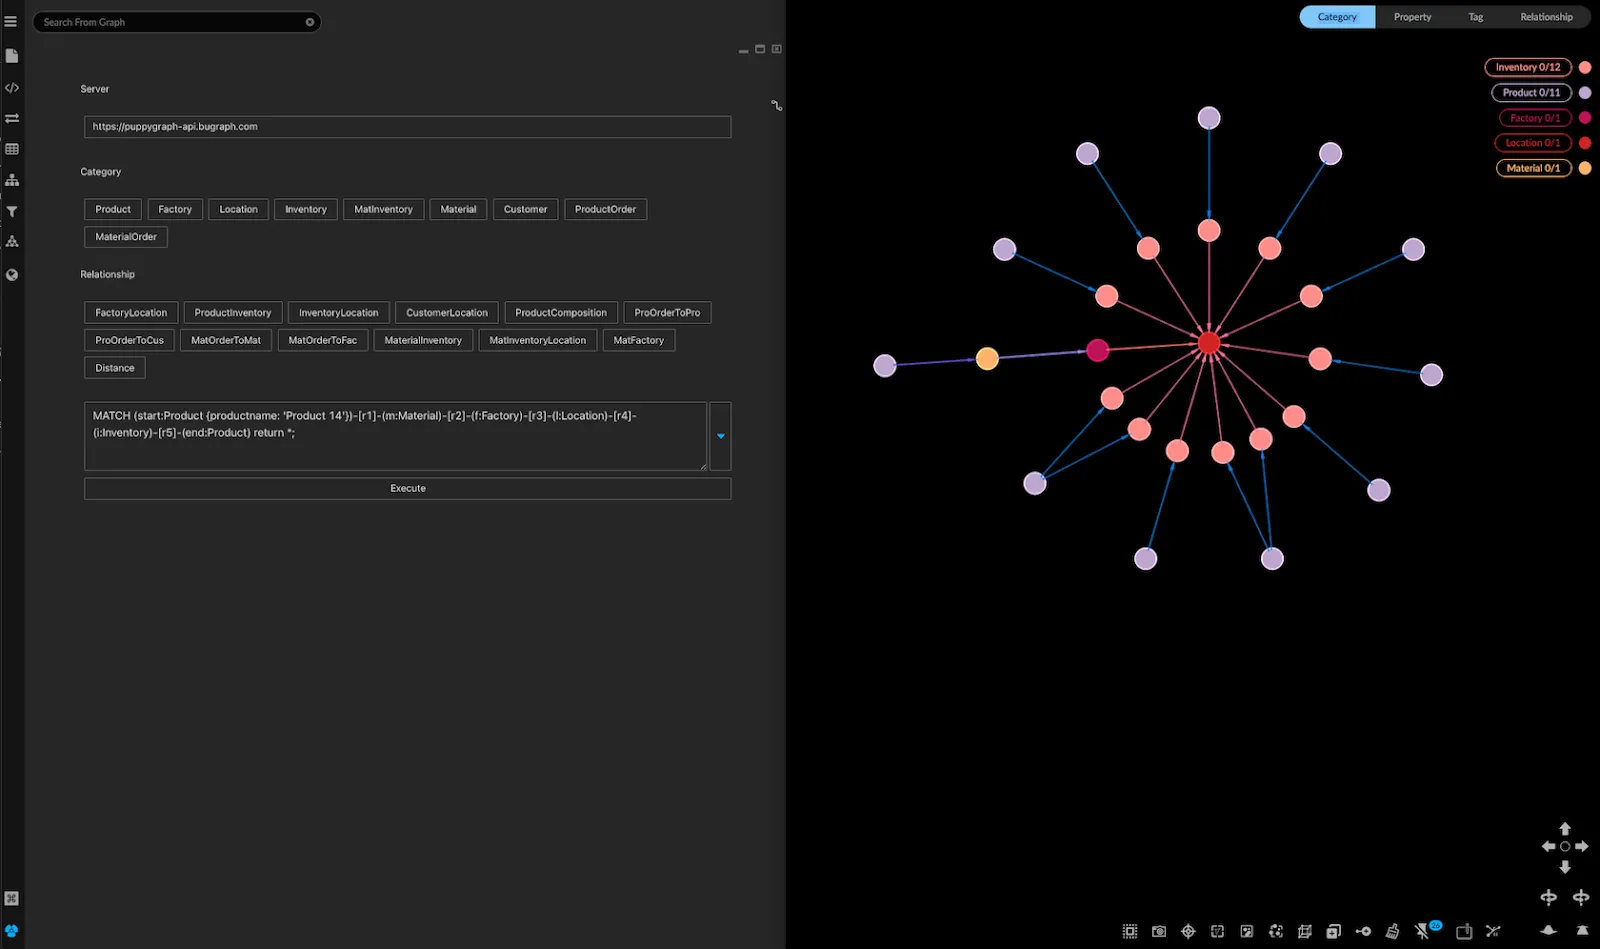
Because Puppygraph allows direct traversal, this query can pull factory locations, associated materials, and inventory availability together — cutting through layers of SQL joins and sub-queries. This is all possible even without a graph database and the ETL processes it formerly required to make this data available as a graph.
Exploring Connected Supply Chains
From that starting point, you can use Kineviz’s Expand function to expand multiple “hops” outward to find other products important to the business.
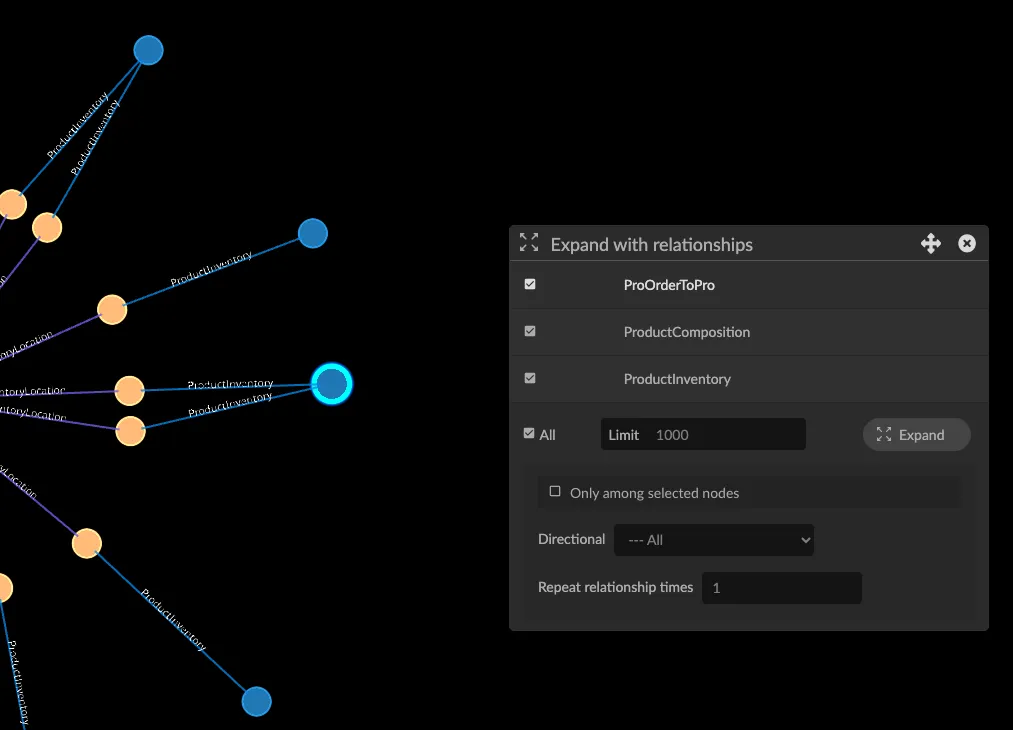
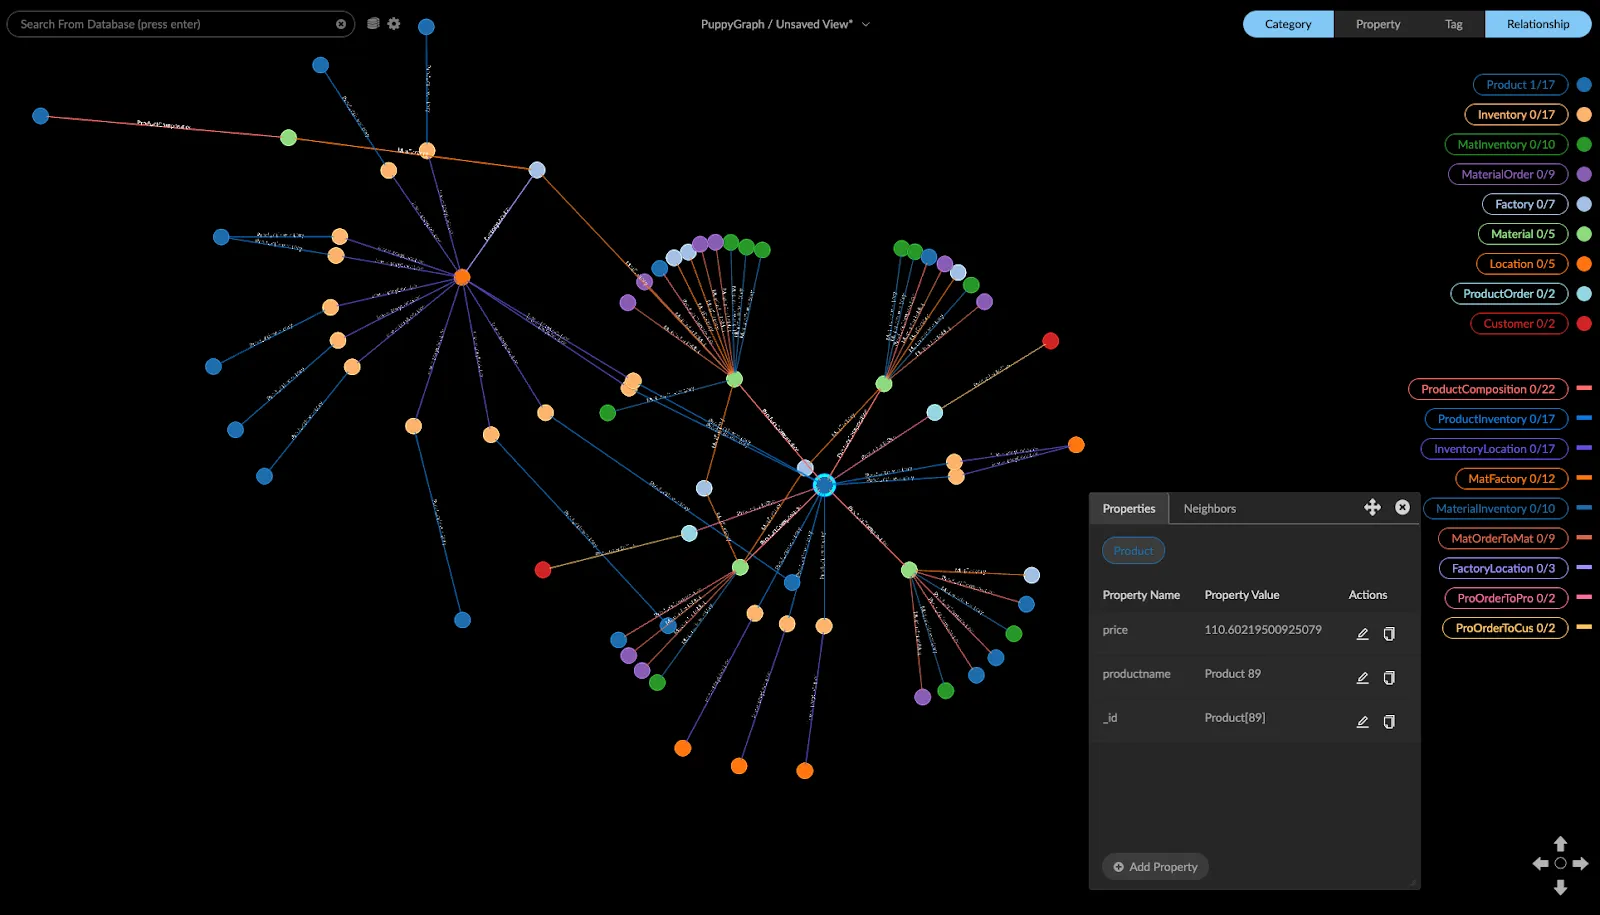
For example, you might spot Product 89 a few degrees away from our initial Product 14, indicating a highly connected relationship between the products.
From this visualization, we see that multiple materials overlap at certain factories, which in turn feed into other products. This quickly highlights critical nodes that can become major manufacturing dependencies if issues arise.
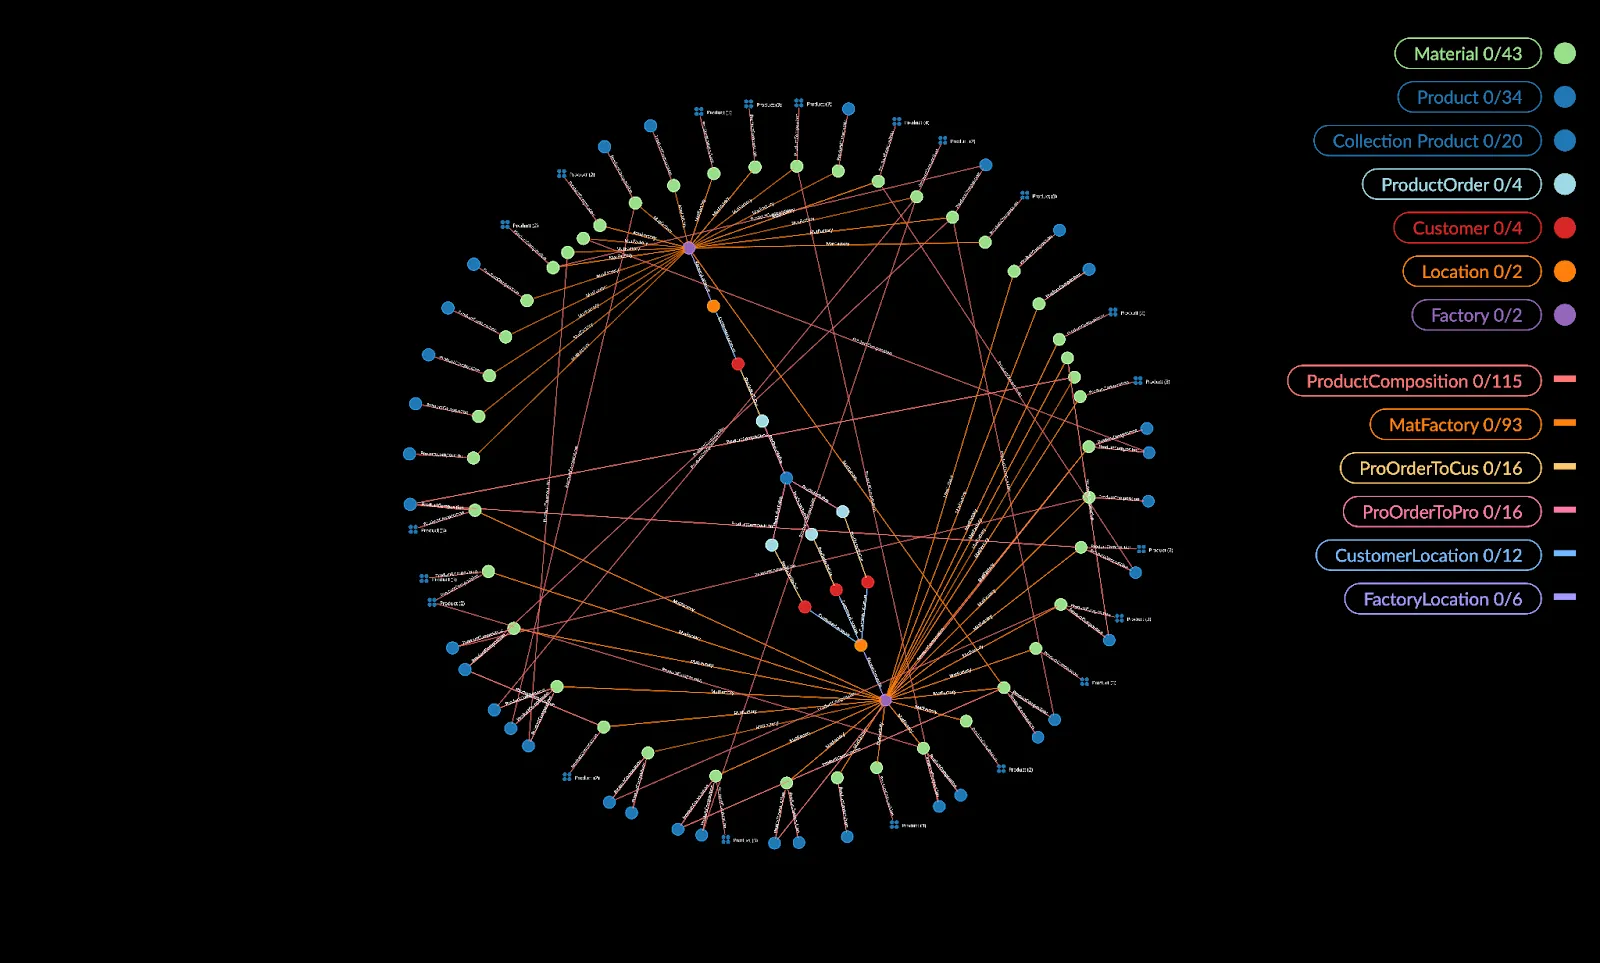
Now we can look in more depth at the two factories that produce Product 14. Using Kineviz’s side-by-side trees or ring layouts, you can easily spot intermediary nodes linking those factories. You can also isolate them by “tracing neighbors” while hiding everything else. Such rapid visual exploration can make it much easier to communicate how to optimize production or where to reallocate resources.
Tracing the intermediary connections between the two factories, starting from Product 14
Finding Top-Selling and Unsold Products
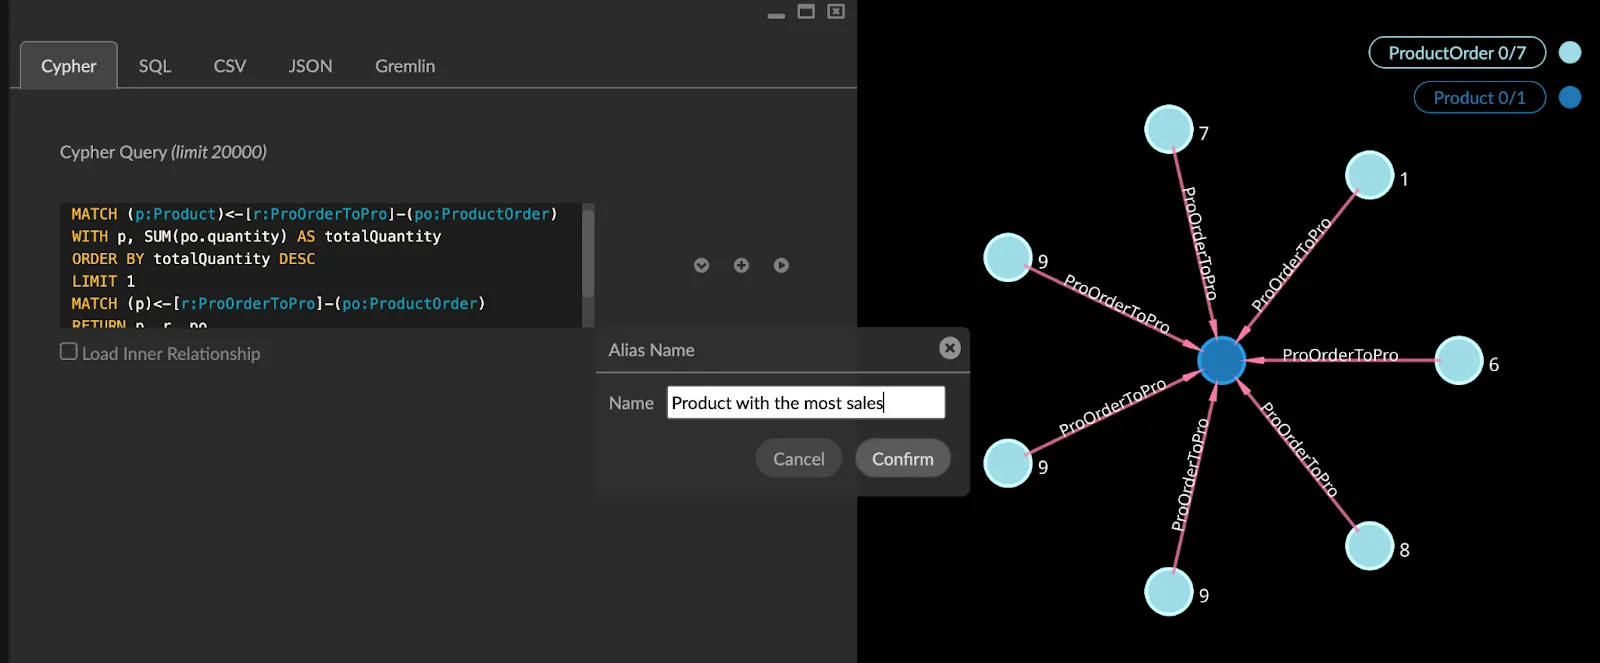
Puppygraph’s no-ETL graph querying also makes it simple to discover which products are performing well — and which are not. For example, to find the product with the highest sales:
MATCH (p:Product)<-[r:ProOrderToPro]-(po:ProductOrder) WITH p, SUM(po.quantity) AS totalQuantity ORDER BY totalQuantity DESC LIMIT 1 MATCH (p)<-[r:ProOrderToPro]-(po:ProductOrder) RETURN p, r, po
In another scenario, you could pull 10 unsold products and visualize them color-coded by price in Kineviz:
MATCH (p:Product) WHERE NOT (p)<-[:ProOrderToPro]-(:ProductOrder) RETURN p limit 10
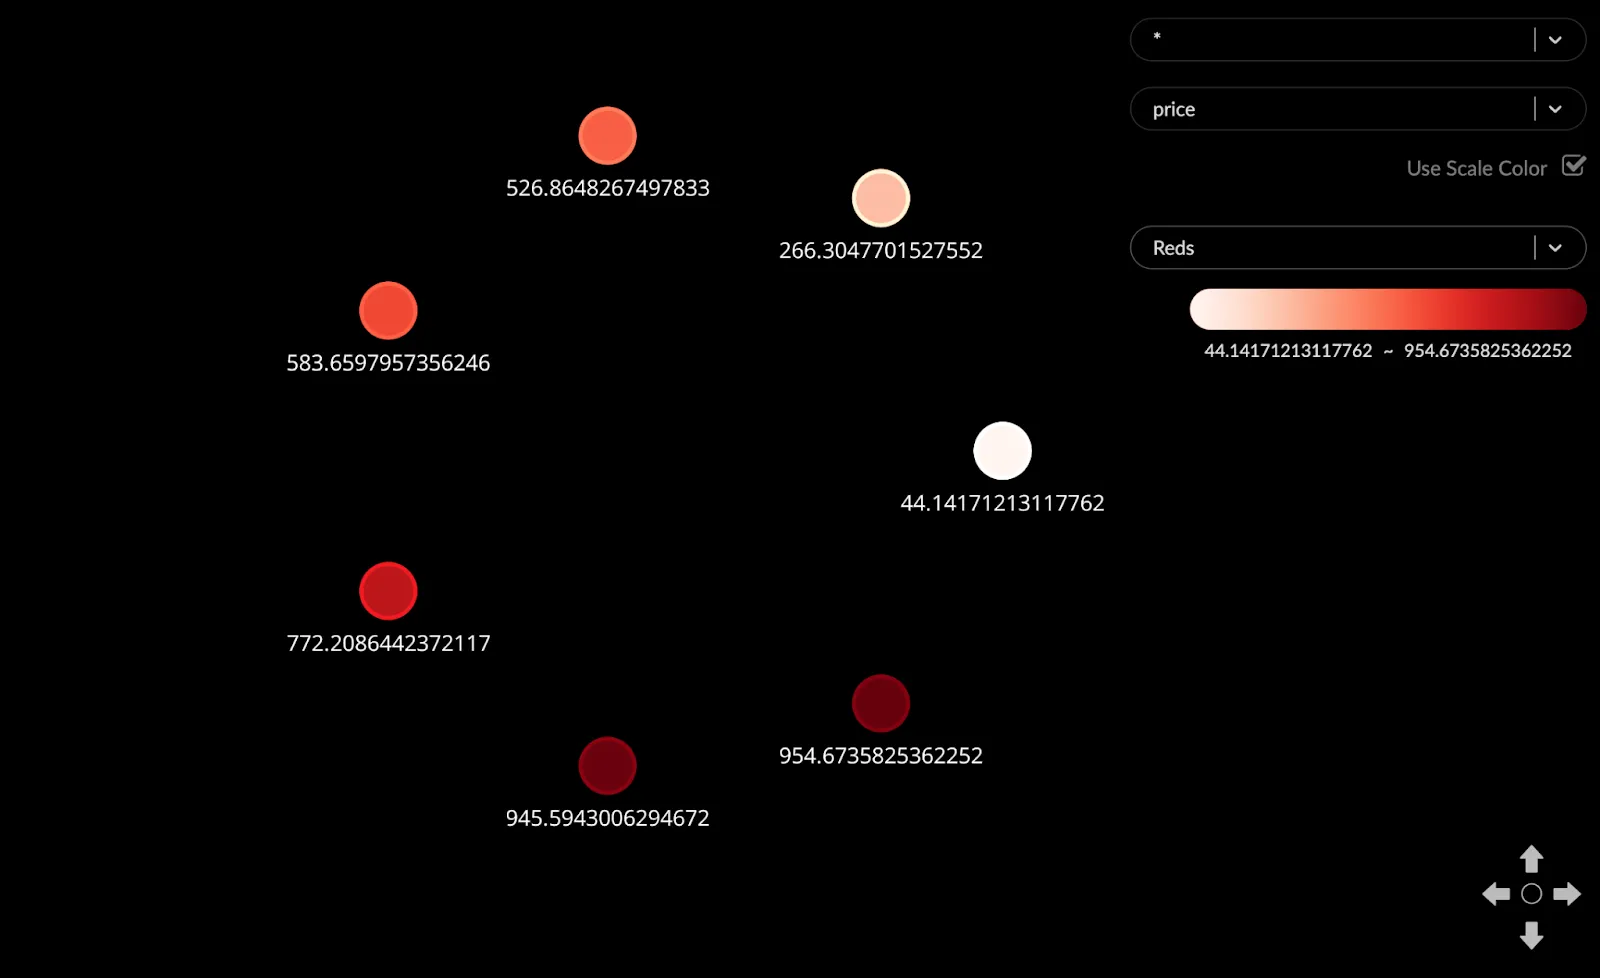
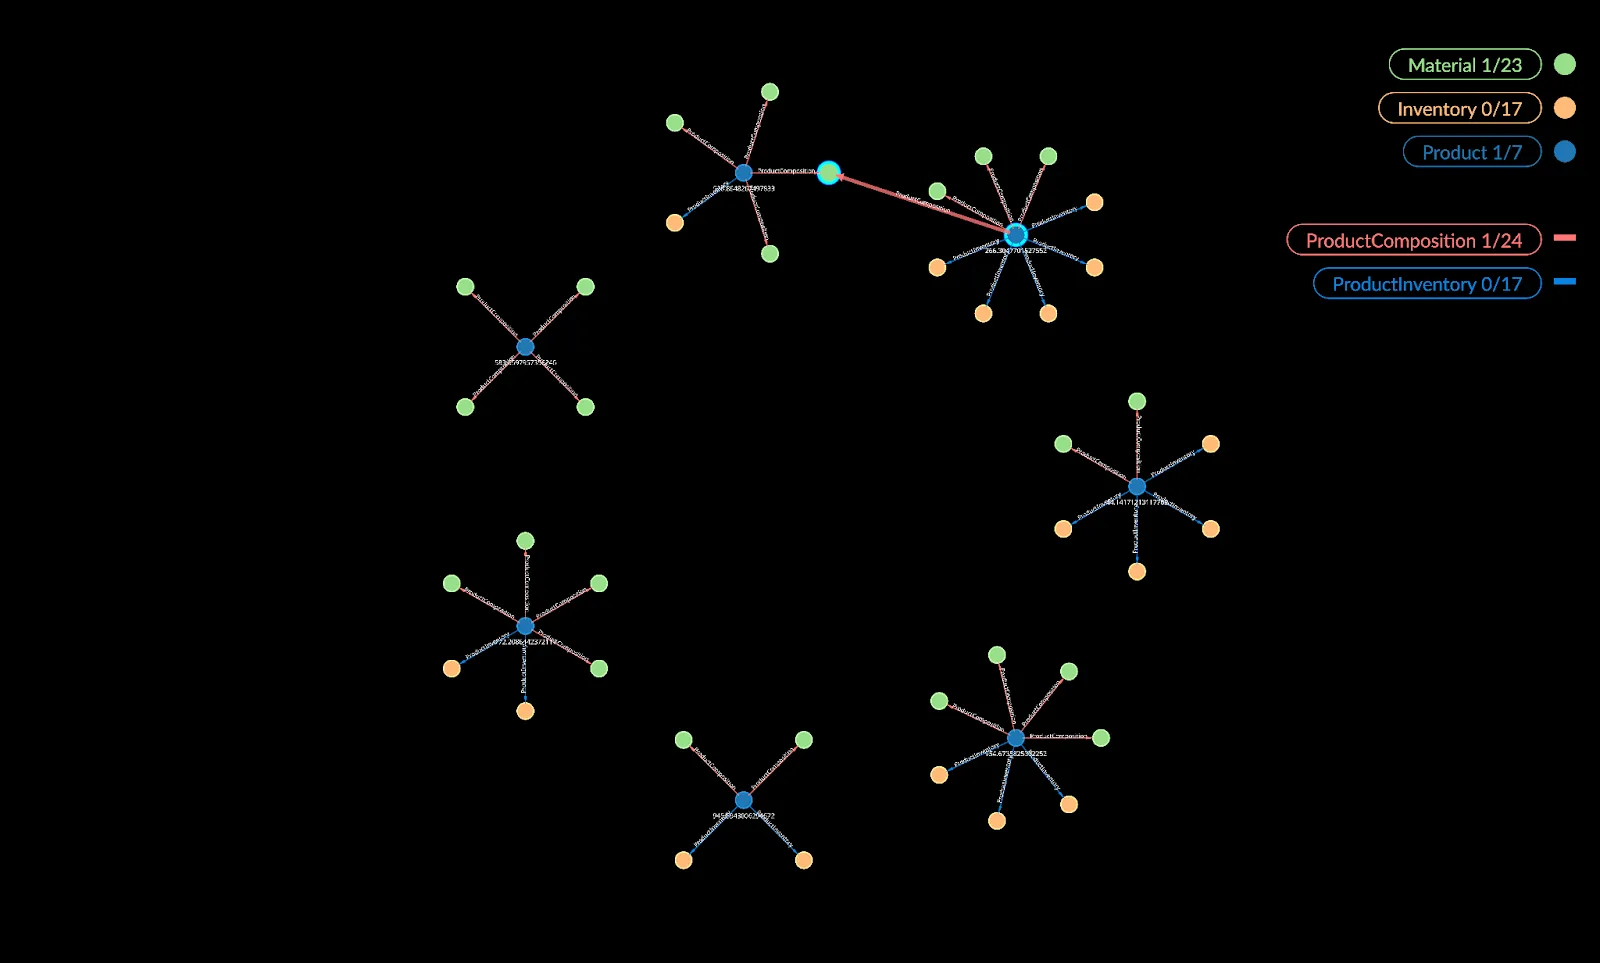
Or, you may notice that two unsold products share the same material, which could suggest changes in your inventory management strategies.
Kineviz’s ring or tree layouts can also help you quickly identify the most central node in your graph — revealing a critical material or chokepoint.
From Connections to Actionable Intelligence
Puppygraph’s no-ETL querying simplifies the process of traversing relational data in a graph-like manner. The overhead and management that comes with a traditional graph database is stripped away, making graph and graph technologies more accessible for those currently working within the SQL ecosystem.
Turning these connected relationships into insights that drive business decisions is precisely where Kineviz excels:
Advanced Visual Layouts & Filtering
Kineviz offers multiple interactive layouts (ring, tree, radial, force-directed) to expose structures, clusters, and outliers. You can also filter dynamically by time ranges, node types, or numeric thresholds, making highlighting the shortest supply routes or critical material dependencies easy.
In-Platform Data Enrichment & Analysis
Pathfinding & Community Detection: Identify key bottlenecks or high-impact products.
Centrality & Ranking Metrics: Compute betweenness, PageRank, and other measures on the fly to isolate pivotal materials, factories, or locations.
Temporal & Geospatial Analysis: Visualize material and product movements in time and space — all within Kineviz.
Story-Driven Dashboards & Collaboration
Share insights with stakeholders through interactive dashboards with annotations, charts, and filters. Cross-functional teams can work together in real-time, speeding up decisions and reducing the need for static, siloed reports.
Integration with Machine Learning
Kineviz integrates seamlessly with data science pipelines (and can run on top of data sources like Puppygraph). Bring in AI/ML outputs — for example, demand forecasts or anomaly detections — and explore them visually in Kineviz.
Scalability & Speed
Leveraging Puppygraph’s ability to handle petabytes of data and execute complex multi-hop queries in seconds means that Kineviz visualization and analytics remains smooth and responsive even as you scale.
Conclusion
Organizations rapidly realize the value in raw data by combining Puppygraph’s real-time, zero-ETL graph querying with Kineviz for advanced analytics and intuitive visual exploration. This synergy can help you optimize supply chain logistics, accelerate decision-making, and clearly communicate critical findings to technical and non-technical audiences, ultimately delivering actionable intelligence that propels your business forward.
Learn more about this Kineviz / Puppygraph integration: https://github.com/Kineviz/puppygraph-graphxr-api
Interested in trying out PuppyGraph and see what it can do for you? Download the forever free PuppyGraph Developer Edition, or book a free demo today.
Contact us at https://www.kineviz.com/contact