
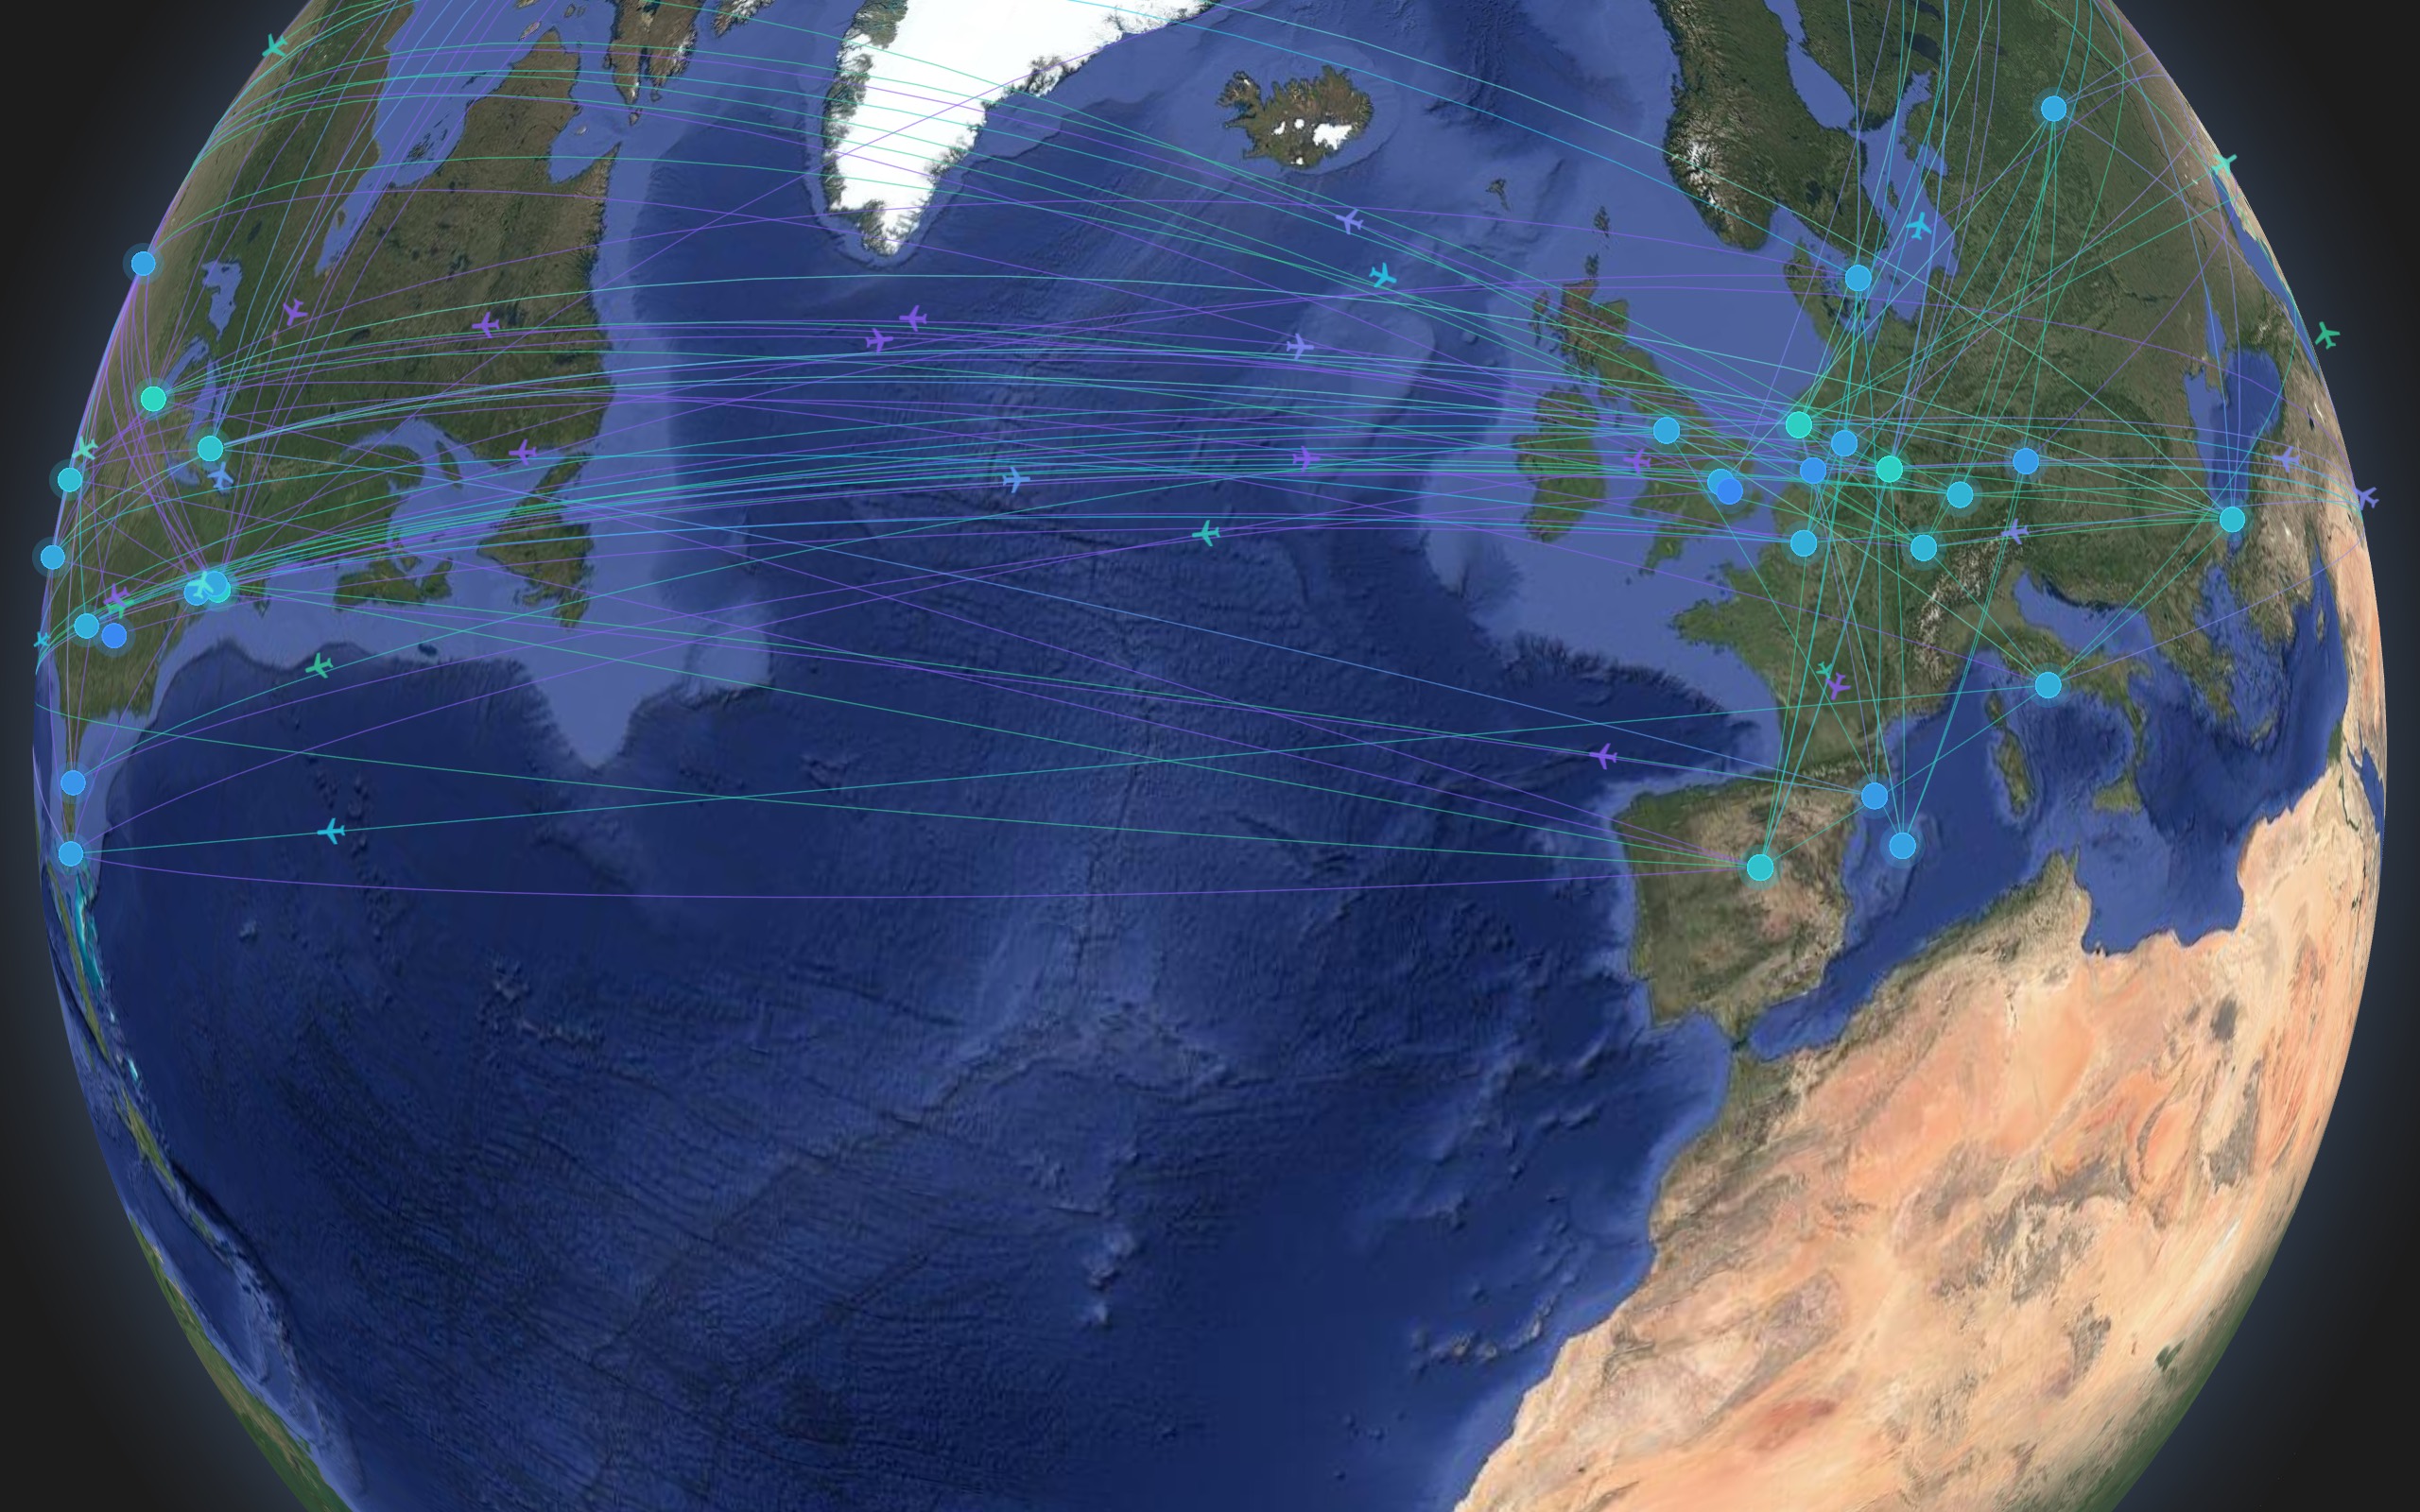
Kineviz Desktop brings the AI workspace for connected data analysis to your computer.
Download Kineviz DesktopA graph database, built in
Desktop ships with an embedded database. Drop in a spreadsheet or a folder and it’s a graph in minutes. Already running BigQuery Graph, Neo4j, or another graph source? Connect directly and analyze in place.
An agent that shows its work
Kineviz Agent is built for investigative work. Ask it to find connections, trace paths, surface what’s unusual. It moves fast, but you stay in control — every step is visible. Nothing goes in the report that you haven’t seen with your own eyes.
In-app sandboxes and tutorials
Sandboxes cover everything from first steps to advanced analytics — open one and see how it works. Or dive right into your own data; it’s as simple as dragging and dropping a CSV.
Frequently Asked Questions
What is Kineviz Desktop?
Kineviz Desktop is an AI workspace for connected data analysis that runs on your own computer. It ships with an embedded graph database, includes Kineviz Agent — an AI agent built for investigative work that shows every step — and provides in-app sandboxes and tutorials covering everything from first steps to advanced analytics. It is available as a free download from kineviz.com.
How do I turn a spreadsheet or CSV into a graph?
With Kineviz Desktop, you drag and drop a spreadsheet, CSV, or even a whole folder, and have an explorable graph in minutes — built by Kineviz Agent, through a mapping you define in Graph Composer, or with visual transforms (extract, shortcut, link, merge). The embedded KoreDB database persists whatever is on your canvas, and Kineviz Agent can also write data straight to it, bypassing the canvas. No separate database setup is required. If you'd rather learn first, in-app sandboxes walk you through the workflow before you load your own data.
Is there a desktop graph database tool that works without a server?
Yes — Kineviz Desktop ships with a graph database (KoreDB) built in, so you can analyze connected data locally without standing up a server. Drop in a spreadsheet or folder and it becomes a graph in minutes. And if you already run BigQuery Graph, Neo4j, or another graph source, Kineviz Desktop connects directly and analyzes the data in place.
What is a good Neo4j Desktop alternative for graph analysis?
Kineviz Desktop is a strong option if you want local graph analysis plus an AI agent. It includes its own embedded graph database for file-based work, but it also connects directly to Neo4j, BigQuery Graph, and other graph sources so you can analyze existing databases in place — adding conversational, AI-assisted investigation on top rather than replacing your database.
Can I use an AI agent to analyze my data locally on my computer?
Yes — your data and your analysis workspace stay on your computer. Kineviz Desktop includes Kineviz Agent, an AI agent built for investigative work on connected data. Ask it to find connections, trace paths, or surface what's unusual in your graph. The AI model itself runs as a cloud service; organizations that need the model on their own infrastructure can host it locally with Kineviz Enterprise. It moves fast, but you stay in control: every step it takes is visible, and nothing goes into a report that you can't verify with your own eyes.
How do I learn graph analysis as a beginner?
Kineviz Desktop includes in-app sandboxes and tutorials that cover everything from first steps to advanced analytics — open a sandbox and see how each technique works on live data. When you're ready, analyzing your own data is as simple as dragging and dropping a CSV, turning it into a graph with Kineviz Agent, Graph Composer, or visual transforms, and saving the result to the embedded database.
Does Kineviz Desktop connect to BigQuery or Neo4j?
Yes. If you're already running Google BigQuery Graph, Spanner Graph, PuppyGraph, UltipaGraph, Neo4j, or another graph or big data store, Kineviz Desktop connects directly and lets you analyze the data in place — no export or migration needed. For data that isn't in a graph database yet, Kineviz turns relational data, spreadsheets, CSVs, and folders of files into graphs in minutes — ask the agent, map them in Graph Composer, or use visual transforms — and the embedded KoreDB database keeps the result local.