
Google BigQuery Graph + Kineviz: Answer the Hardest Questions from Your Connected Data
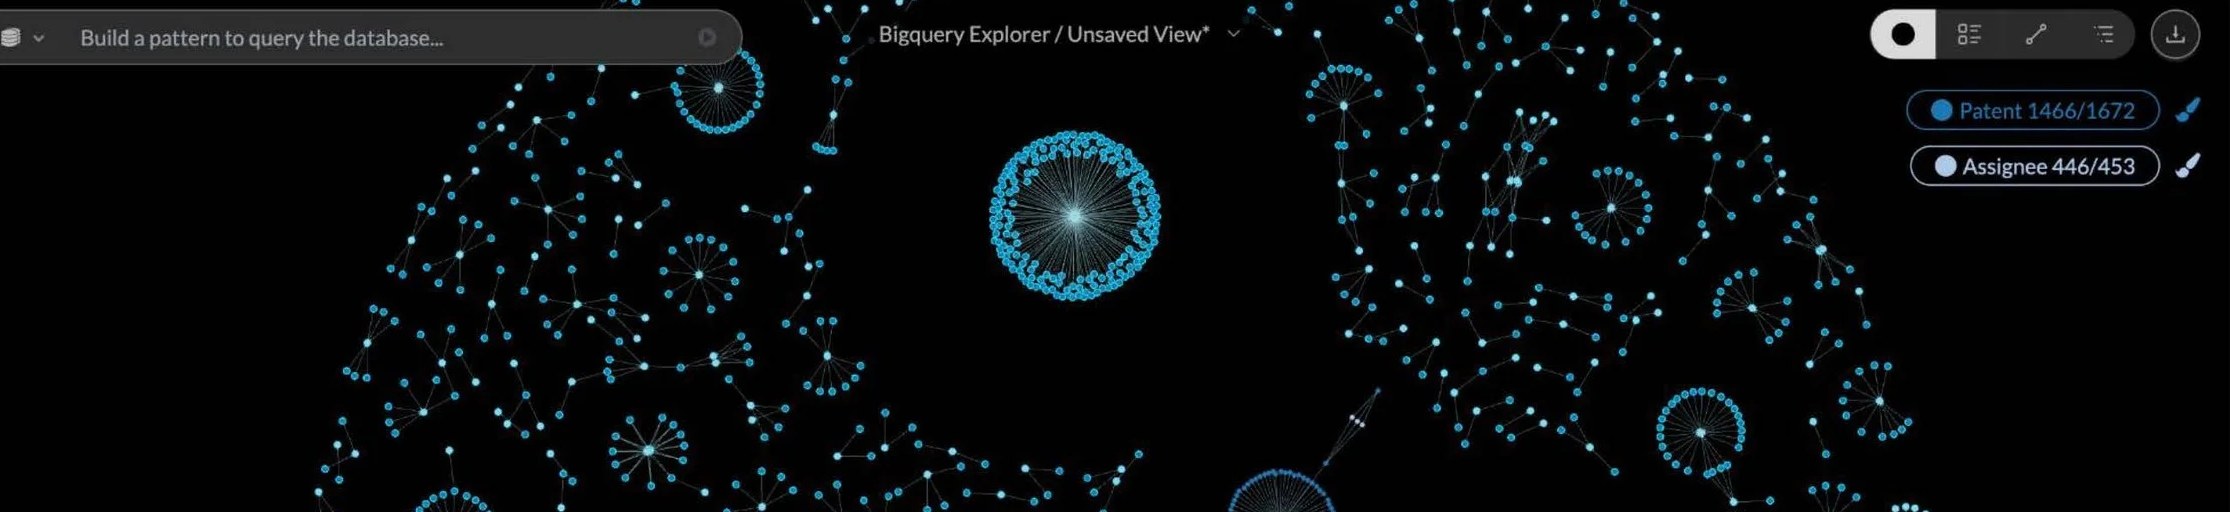
If you haven’t heard the news: the Google Cloud team has officially announced the general availability release of BigQuery Graph.
On behalf of the Kineviz team, I’d like to offer a big congratulations to Bei Li, Candice Chen, Vinay Balasubramaniam, Yun Zhang, and the rest of the BigQuery team who worked hard to make this project happen. The GA release of Google BigQuery Graph is a huge vote of confidence in the power and potential of graph technology to solve some of today’s most pressing data challenges — especially when it comes to connections and relationships between data points.
Of course, Kineviz fully supports BigQuery (including BigQuery Graph), so if you need a low-code, non-technical tool for exploring your data in BigQuery, do check us out. You can explore Kineviz for free via Kineviz Desktop.
Why Graph Technology
Organizations are investing in graph technology to understand how customers, transactions, suppliers, assets, and operations connect across the business. Graph data models make it possible to capture these complex relationships at enterprise scale, uncovering critical patterns that traditional tables and reporting tools often miss.
Adopting graph technology, however, is only the beginning.
Many organizations still depend on specialized engineers who know graph query languages to answer investigative questions or explore new relationships. Analysts and business users often wait for technical teams to build custom queries before they can move an investigation forward, slowing decisions and limiting how broadly graph insights are used across the organization.
Making Visual Graph Analysis Accessible to All
Kineviz extends the value of BigQuery Graph and Spanner Graph on Google Cloud by making connected data accessible through AI-assisted visual analysis. Analysts can explore relationships, investigate emerging patterns, validate findings, and trace every insight back to its original source without writing complex graph queries.
Because Kineviz connects directly to graph data in Google Cloud, organizations can analyze connected data where it already resides while Google Cloud continues to serve as the governed system of record.
Making graph analysis accessible delivers benefits that reach far beyond individual investigations. Teams can begin exploring connected data as soon as graph models are available, helping organizations realize value from their graph investments sooner. Fraud, compliance, trust and safety, and operations teams can investigate connected data directly instead of relying on specialized engineering resources for every new question.
For example, one gaming integrity team reduced relationship analysis from three days to 3 minutes after adopting Kineviz, illustrating how visual graph analysis dramatically accelerates investigations while keeping analysts connected to the underlying evidence that supports every conclusion.
Your Turn
The GA release of Google BigQuery Graph is a testament to the value of connected data. Whether you’re using a graph database like BigQuery Graph or Spanner Graph, or you just need a tool to help you analyze your non-graph data and find its hidden relationships, Kineviz is here to help you discover the connections that matter most.
Ready to make connected data accessible across your organization? Explore your data in Google BigQuery Graph with Kineviz Desktop.