Sports Integrity: Investigating the Connections Already in Your Data
How Kineviz queries your existing SQL databases, including those behind iBase, and presents the records as connected data for investigation.

Sports integrity teams have case files, laboratory results, employment histories, ownership records, wagering data, and years of investigative notes. Answering a question often means bringing several of those sources together.
For example: Has this particular mechanic worked anywhere we have had an adverse finding?
The employment history may be in i2 iBase, the laboratory result in a spreadsheet, and an earlier investigation in a closed case file. To answer this, an investigator has to find the employers, check each team’s history, and compare dates. Perhaps they can find a colleague who remembers an old case to help out. Without such memories to help put the information in context, the process towards closing a matter can take much longer.
The time involved affects which questions get answered. If checking a possible connection takes a day and a half, a busy team will usually wait until it has a strong reason to look. Questions that might have led somewhere might not get explored.
Using Kineviz makes these searches easier because the visual analysis environment connects directly to the Microsoft SQL Server database behind iBase. This means you can start with the records and relationships already in your database, without first moving the archive into a replacement system. Right now, it’s a read-only bridge with SQL Server, but we hope to validate a live iBase installation soon.
This blog post references the new Kineviz Sports Integrity Sandbox, a fictional dataset you can experiment with while exploring the Kineviz platform. Try it out here to follow along.
Connecting Kineviz to the Database behind iBase
An iBase archive already contains much of the structure needed for this kind of data analysis.
People, teams, vehicles, accounts, and cases are recorded as entities. Employment, ownership, and other relationships are stored as links between them. Investigators have spent years creating those links, often with dates and supporting details.
Kineviz uses that structure to display the records as a graph visualization (i.e., a network of connected entities). Using our example question from above, an analyst starts with a mechanic’s name, follows employment links to the teams, and then inspects the vehicles and findings associated with each team. As the analyst expands a record, the bridge queries the source database for the related records.
To do that, we need to map the database tables to the entities and relationships that investigators recognize. We keep this mapping in a readable configuration file: where the people are stored, which tables contain employment links, and how those links should be interpreted. The source database stays in place and remains the system of record.
This first step – connecting Kineviz to iBase – addresses the connections available in the database. A laboratory spreadsheet or closed file held elsewhere still needs to be brought into the analysis and matched to the relevant records. Connecting to iBase does not, by itself, connect every source a sports integrity team uses.
Checking That the Links Mean What We Think They Mean
One detail in this process is easy to overlook: A database query can return the right two records while describing their relationship backward.
For example, a link between Avery Chen and Northwind Logistics could be displayed as “Avery Chen works for Northwind Logistics” or “Northwind Logistics works for Avery Chen.” Both queries can return the same records. Checking that the query runs successfully will not catch the mistake.
The Kineviz mapping tool inspects the tables and proposes entities, relationships, and directions. It then shows examples in both directions, using actual names from the records. A subject-matter expert who understands the source data reviews those examples and confirms the interpretation before analysts use it.
This review step matters because an analyst reading an employment link should be able to rely on its meaning. Kineviz helps prepare the mapping, but someone familiar with the archive needs to check it.
Following a Mechanic’s Employment History
Our fictional motorsport sandbox includes Juno Dowd, a senior mechanic who has worked for three teams since 2022. His employment records show Castellan Competition first, then Apex Motorsport, followed by Borealis Motorsport. The sandbox contains fuel-sample findings on cars run by Apex and Borealis, but none recorded for Castellan.
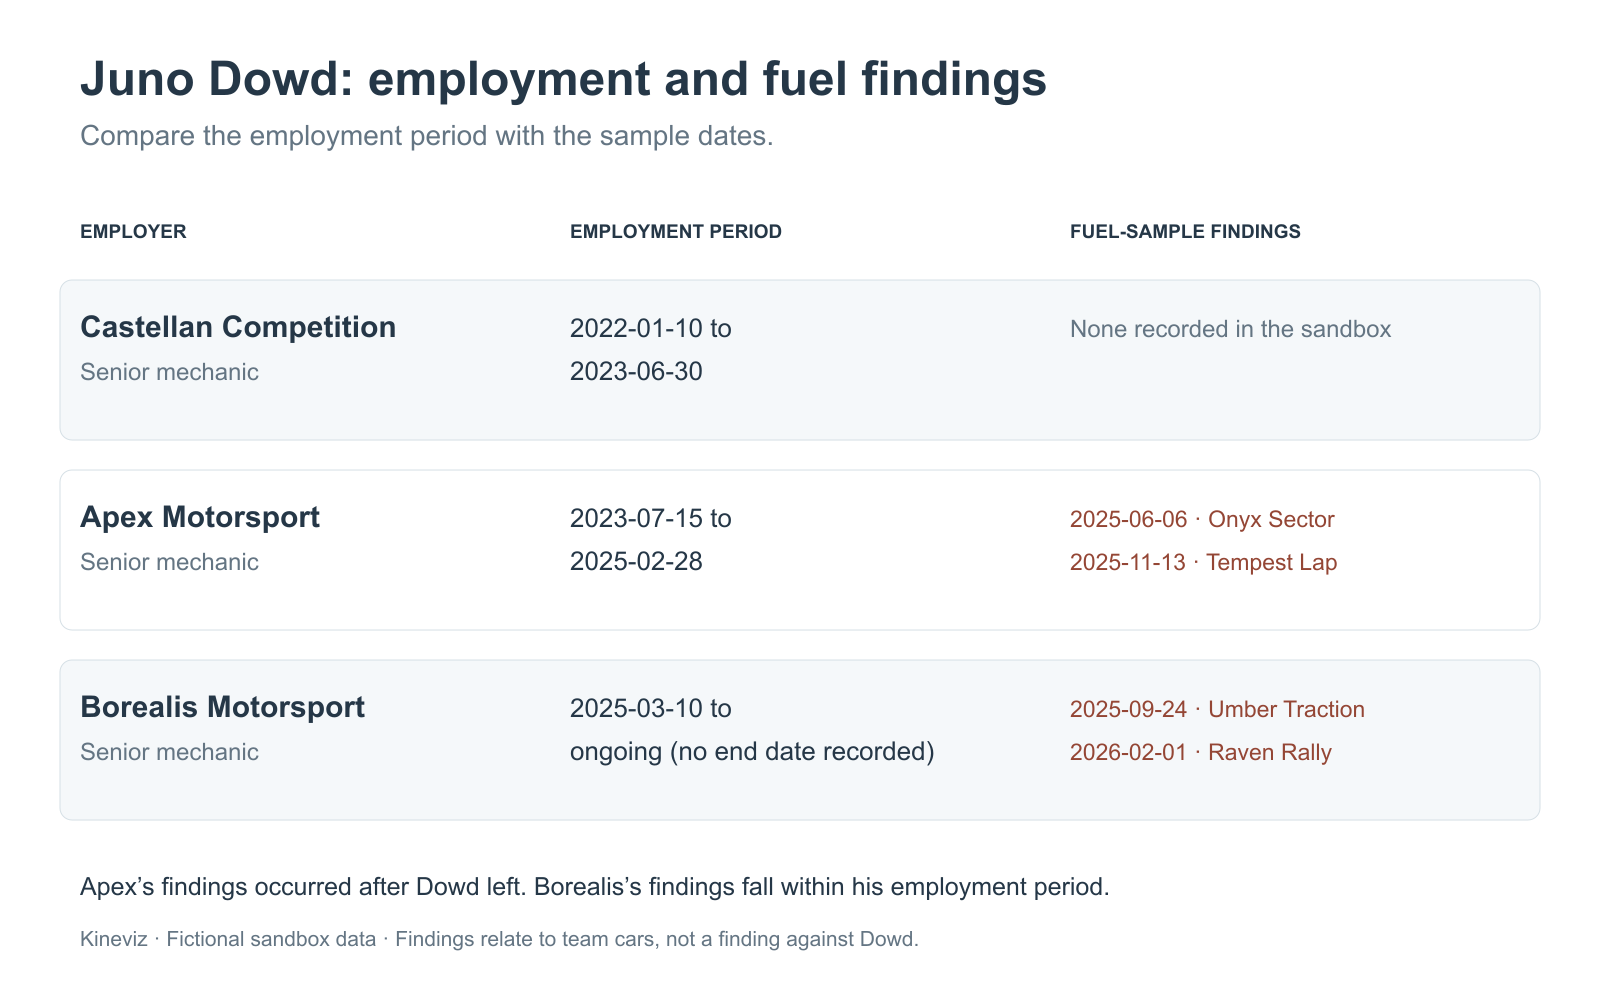
Employment and fuel-sample dates from the fictional sandbox. Apex’s findings were recorded after Dowd’s employment there ended.
The dates change how we read that result. Dowd left Apex in February 2025; its two fuel findings were recorded in June and November. Borealis’s findings fall within his recorded employment there. An investigator would need to examine his responsibilities, the sample records, and other explanations before drawing any conclusion about his involvement.
Having the employment history and findings together makes that next step easier. The investigator sees which records need attention and checks the timing without assembling a separate history for every team.
An Investigation into Wagering alongside Race Participation
Another example begins with driver Mateo Reyes.
Three of his recorded associates hold wagering accounts. Those accounts placed bets on meetings in which he drove, with stakes ranging from €2,400 to €7,000. Other accounts in the sandbox have recorded stakes of €20 to €120.
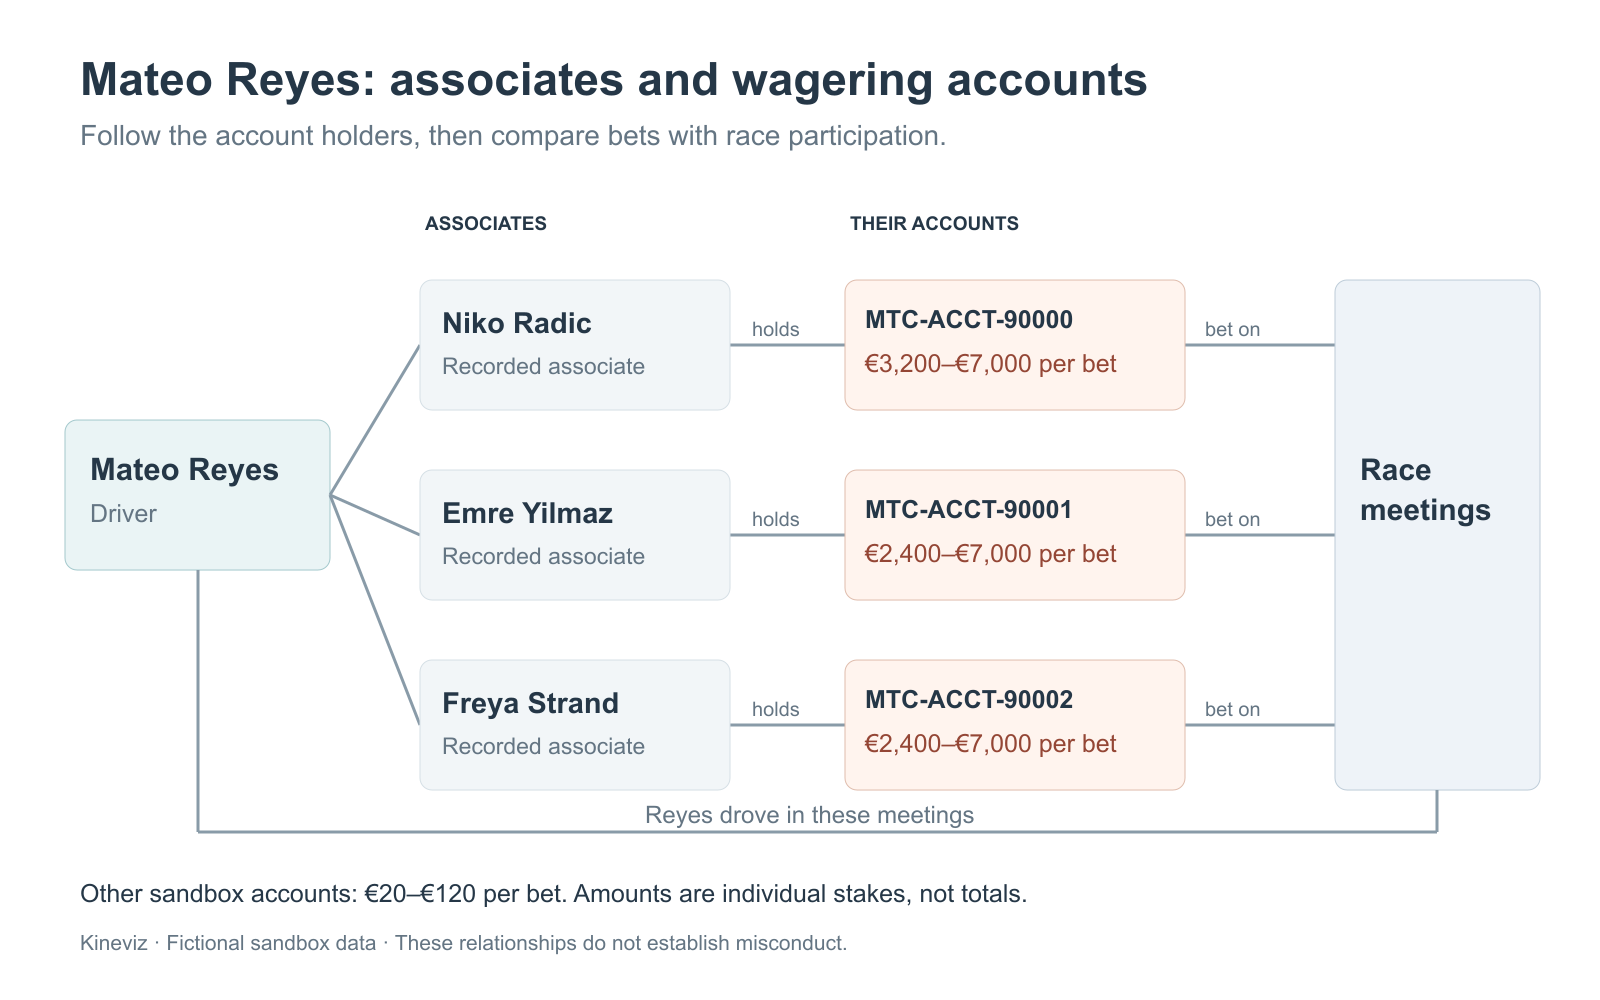
Recorded associations, account holders, and bets in the fictional sandbox. The amounts shown are individual stakes, not account totals.
An investigator looking only at a race entry would not see the accounts. Looking only at an individual bet would not explain the account holder’s connection to the driver. Following both sets of relationships gives the team specific transactions to review. It does not yet establish that the wagering was coordinated or improper.
The same process helps with case history. Several reports about one person may have been closed at different times for insufficient evidence, but bringing them together allows an analyst to compare their sources, dates, and substance. Some may repeat the same allegation. Others may contain information that warrants a fresh look. The underlying reports still have to support any decision to reopen an inquiry.
What We’ve Tested
In preparing this sandbox example, we stood up the Kineviz bridge against a live SQL Server session with 293 queries, including the requests made when an analyst expands a record to see its connections. Testing also covered cases where one relationship type connects several kinds of entities.
The bridge reads from the database without writing changes back. Query results are sent to Kineviz for analysis. This approach does not require migrating the archive into another database. This is the direct connection we are developing, and the SQL Server tests give us a basis for the next stage of iBase validation.
Try the Sports Integrity Sandbox
We have prepared a ready-to-play sandbox with Kineviz KoreDB as the graph data store. In the future, we will create a git repository for readers to recreate a full SQL-to-Kineviz solution. The sandbox contains 573 fictional records and 2,039 relationships covering people, teams, cars, race meetings, wagering accounts, testing results, and inquiries. It demonstrates the investigative workflow described above.
In the sandbox example, there are four starting questions covering employment, shared addresses, wagering, and case history. Open one to see the relevant records, then follow the links to examine the details.
Explore the sports integrity sandbox