
Supply Chain Transparency: Tracing the Path from 1 Bad Chicken to 10 Store Names
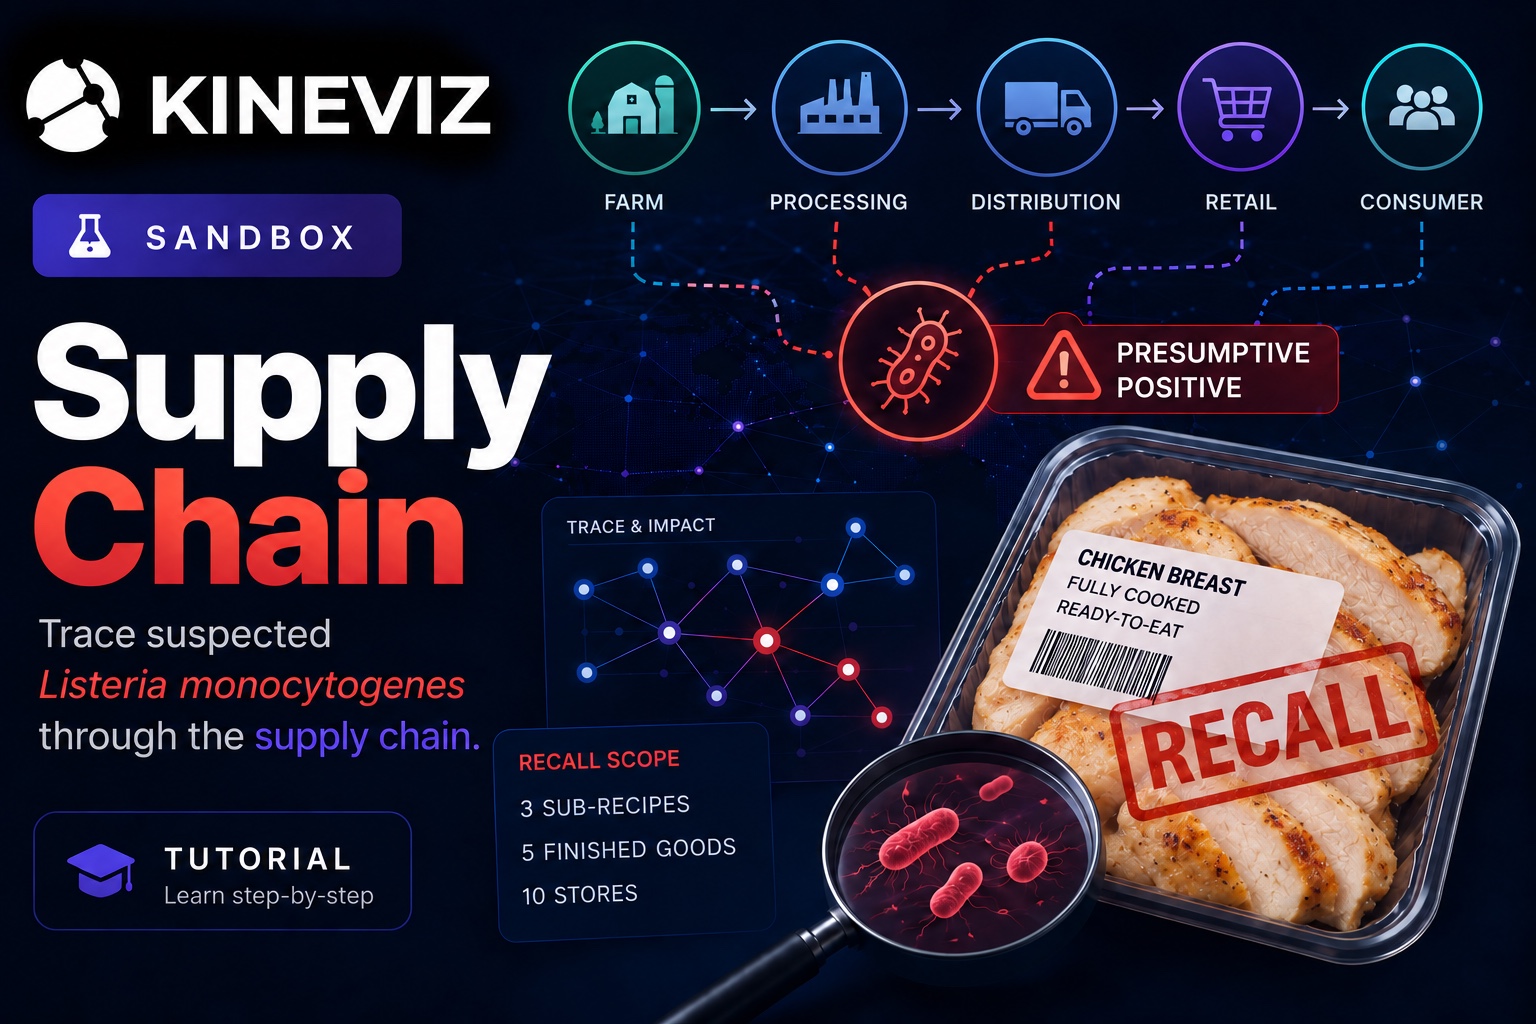
One of your suppliers notifies you that a lot of fully cooked, ready-to-eat chicken breast it shipped you has tested presumptive positive for Listeria monocytogenes. Everything you made with that chicken breast is now in scope for the recall, and the recall has to reach every store that received any of those products. A recall may begin with suspected contamination, before a foodborne illness outbreak is confirmed.
But which of your stores are those? In most companies, no single report answers that, because supplier receipts, recipes, and store orders sit in different systems.
This walkthrough explores food traceability in the Kineviz platform, following a suspect ingredient through the products made with it to the stores that sell them. For our example data, we’ll use one of the new sandboxes now available in Kineviz cloud. Sign up (it’s free) and follow along if you’d like!
The stores sit at the far end of the supply chain. You reach them with a forward trace, following the product downstream link by link until you have a list of names someone can call. Food companies rehearse this in a mock recall (a practice run of a real recall), and the sandbox lets you run one yourself.
About the sandboxes: At Kineviz, we’re publishing a series of online sandboxes, which are self-contained Kineviz (formerly GraphXR) projects with the data already inside them. Each one follows an exploratory User Guide, and this one adds a step-by-step tour of the whole recall trace. There’s nothing to install and no spreadsheet to load first.
The Pathway
In the Supply Chain Sandbox, the flow is straightforward.
The data model behind it has two kinds of nodes. Every business, from supplier to plant to store, is a Facility. Everything that is bought, made, or sold is an Item: raw materials, sub-recipes (intermediate preparations such as Grilled Chicken Breast), and finished goods (the products a customer buys by name).
Three relationships figure into the recall. SUPPLIES links a supplier to the raw materials it ships, CONTAINS links each Item to the Items that go into it (together, those links are your bill of materials), and SELLS links a store to what it sells. Inside the sandbox, click “Show the schema” to see the whole model.
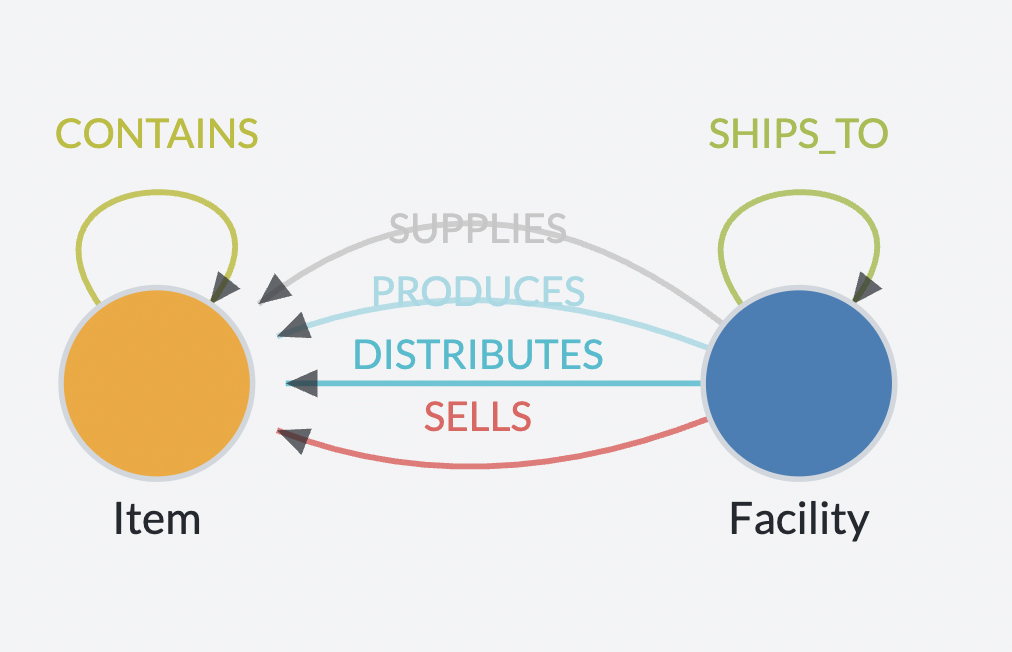
Figure 1: The data model of our supply chain management example
The model is small enough to take in at a glance, and it covers everything the recall needs.
Supply Chain Recall Traceability, One Question at a Time
The trace takes four questions. Each one is a single hop in the graph.
Start at the supplier named in the recall notice and look at what it supplies you. It ships you six items, and one of them is the chicken breast under recall.
Next, run a where-used lookup on the chicken breast. (Where-used is the ERP term for finding everything made with a given ingredient.) Three sub-recipes contain the chicken breast: Cooked Smoked Pulled Chicken, Grilled Chicken Breast, and Breaded Chicken Patty.
Run the same lookup one level up. Those three sub-recipes go into five finished goods: Chipotle Chicken Avocado Melt, Cobb Salad, Southwest Salad, Chicken Rice Bowl, and Chicken Caesar Wrap.
Finally, find the stores that sell any of those items. In the sandbox, click the Facility pill in the legend at the top right, and 10 of the 122 Facilities light up. Six are cafés (foodservice accounts) in Wisconsin, Michigan, Ohio, and Minnesota, and four are general retail stores in Ohio, Indiana, Colorado, and Oregon.
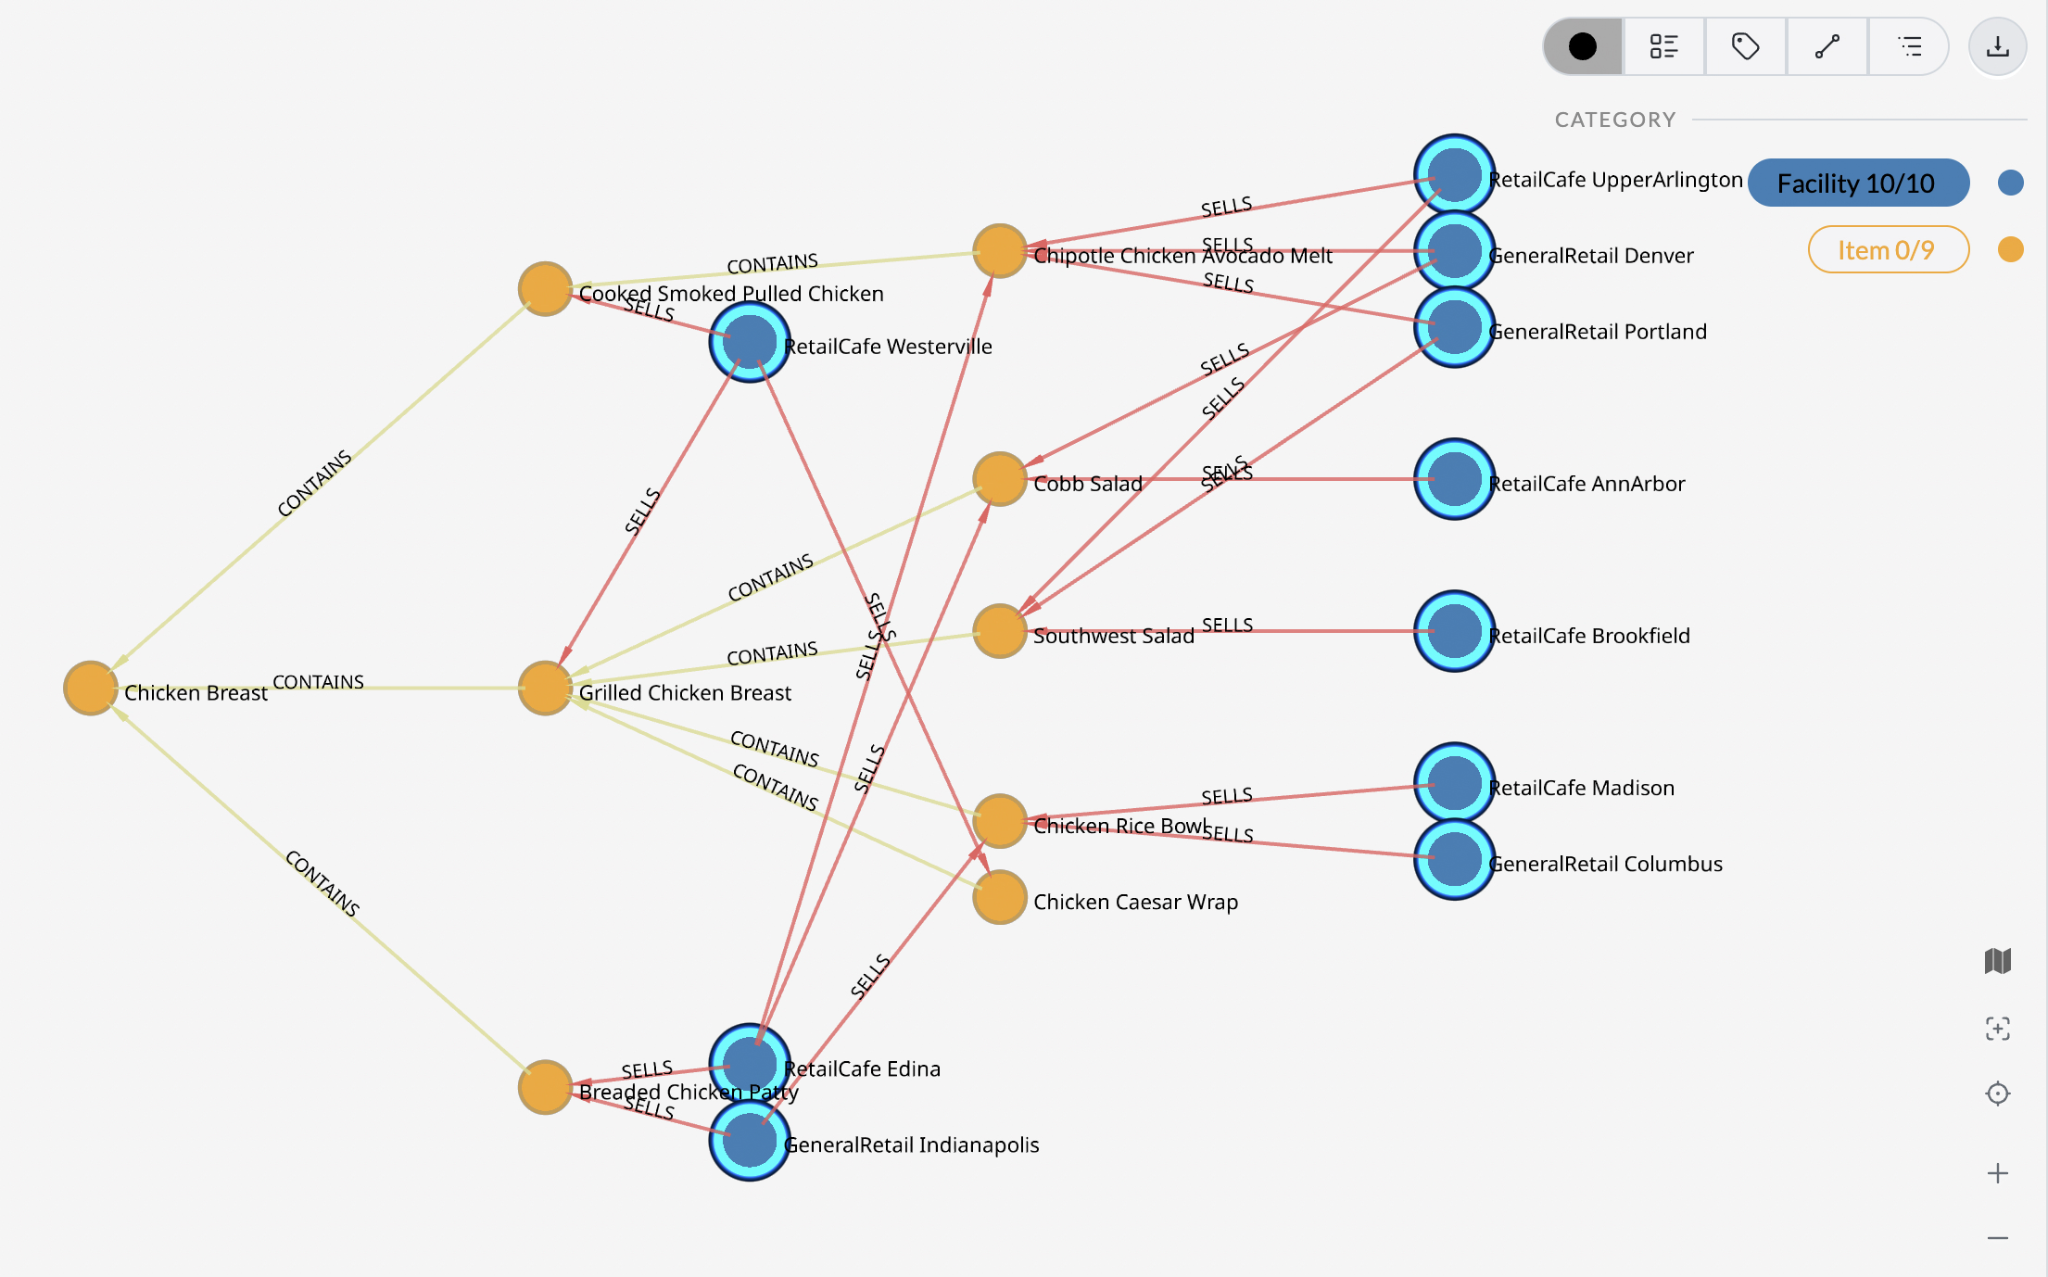
Figure 2: The forward trace as a graph visualization, with the chicken breast on the left and the stores that sold affected products on the right
See the trace run in the video below.
To hand the list off, export it as a consignee list, the recall term for everyone who received the affected product. (1) Select the Facility pill on the right, → (2) click Table in the left menu → (3) Facility → (4) More Actions → (5) Export Selected as CSV. A spreadsheet of store names and cities lands in your downloads folder. Now you have a list your recall team can act on.
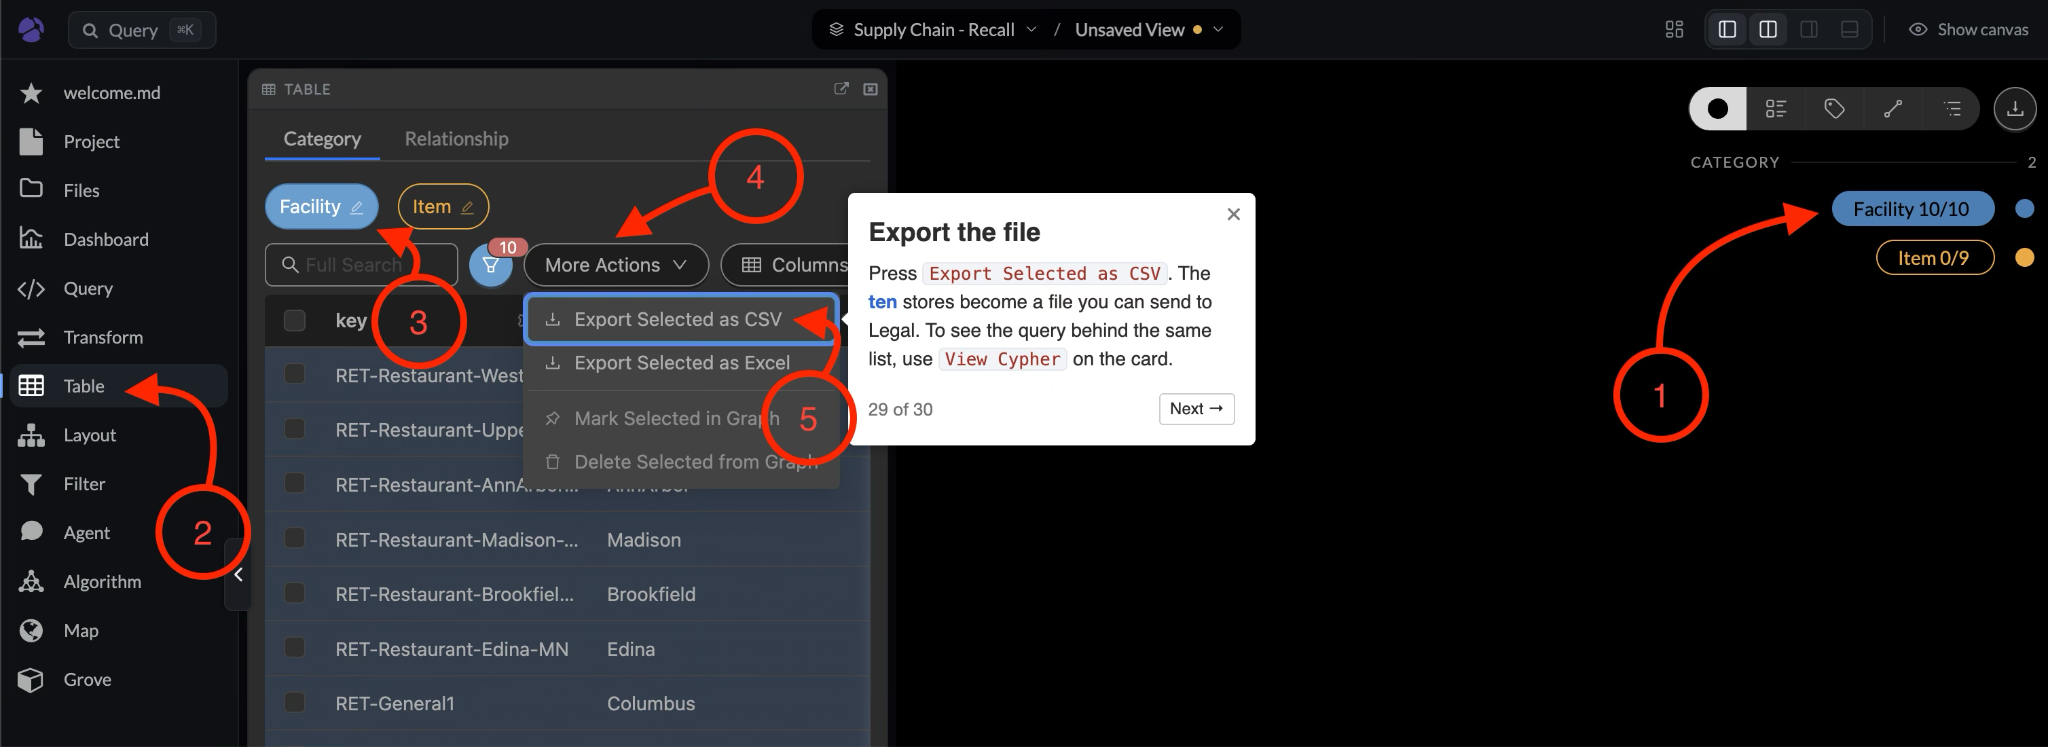
The 10 stores that sold affected products, shown as rows before export
Why These 10 Stores Are the Right List
Before the list goes anywhere, check how its scope was drawn.
The number of affected products depends on where you draw the line, but the store list doesn’t. Count only the five finished goods, and you get 10 stores. Add the three sub-recipes that are also sold on their own, eight products in all, and you still get the same 10.
The list is also a broad recall scope. The sandbox data carries no lot codes, so the 10 stores are every store that could have sold product from that lot rather than every store that did. With lot-level data you could narrow the scope. Without it, the 10 stores are the worst case, which is the one you want first anyway. The data is synthetic and ACME Foods is a stand-in name, but the structure is the one a real supply chain has.
Your Turn
If your team regularly deals with questions of downstream impact, the Supply Chain Sandbox is worth an afternoon.
Once you open the sandbox, two buttons are waiting. “Show the schema” visualizes the supply chain you just read about, and “Take the tour” walks you through the recall itself, step by step, all the way to the CSV export.
Beyond Recalls
A recall is one case of impact analysis, the work of finding out what depends on a given supplier, plant, or part. The same trace shows what’s exposed when a single-source supplier misses a shipment, a plant goes offline, or a part gets pulled.
Most of the time, it’s your job to follow the connections outward until you reach the people who have to be notified. The tracing is usually what takes the longest. Deciding whether to pull products or switch suppliers goes quickly once you have the list.
You can walk through any Kineviz sandbox the same way: open one, take a real question end to end on its data, and decide for yourself whether the shape matches something on your own desk.