
GraphBI: Expanding Analytics to All Data with GenAI, Graph, and Visual Analytics
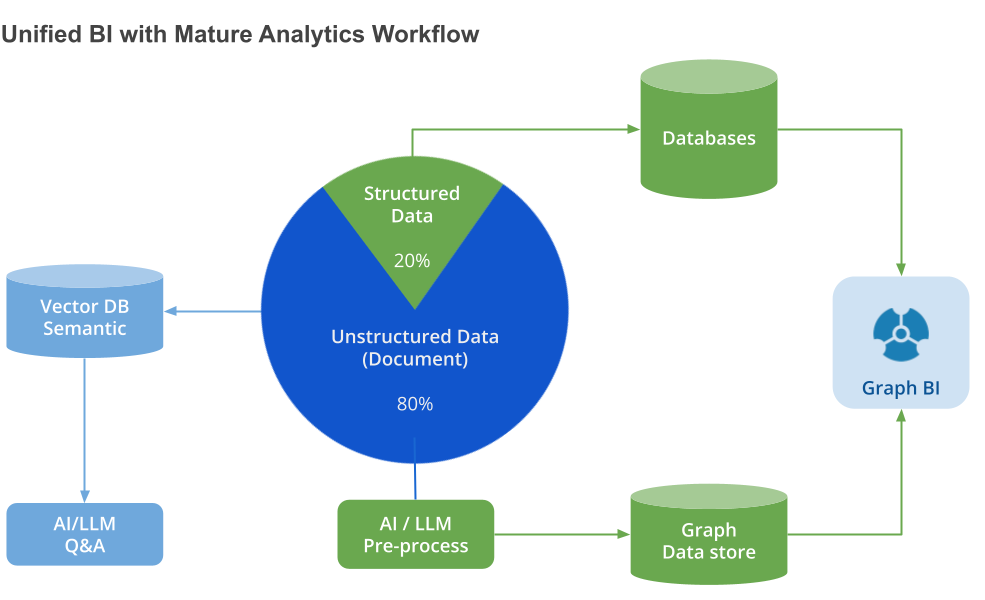
Data is useful to the extent that it enables decision-making, and that involves evaluation of patterned information in an appropriate context. For big data, business intelligence (BI) workflows and tools are widely used for this purpose. Introduced in 1989 by Howard Dresner, BI refers to “concepts and methods to improve decision-making using fact-based support systems.”
Traditional BI provides engagement with structured tabular data, such as that found in SQL or NoSQL databases. It’s estimated that 20% of enterprise data is structured. The other 80% is unstructured, and this potentially vital information — about internal policy, legal cases, product specifications, research results, and more — remains underutilized.
Recent advances in technology encourage a GraphBI approach that extracts graph- structured information from unstructured documents using generative artificial intelligence (GenAI), and delivers it to a unified platform for exploration and analysis.
GraphBI for Big Data
Re-imagined big data workflows make it possible to combine GenAI knowledge mapping with a powerful GraphBI visualization and analytics toolkit.
The design supports the need to extract verifiable, trusted information from unstructured data at scale and deliver it for iterative exploration and decision-making. Furthermore, since both structured and unstructured data can be automatically expressed as property graphs, the reach of GraphBI extends to any collection of data sources.
GenAI and Knowledge Mapping for GraphBI
With today’s GenAI options, we can rapidly extract entities, relationships, and contextual information from unstructured documents. Technologies like Retrieval-Augmented Generation (RAG) and GraphRAG can enhance AI-mediated summarization and Q&A. But they often function as black boxes, making it difficult to explain or verify the results.
GraphBI takes a different approach: it uses GenAI for data pre-processing to transform unstructured data into a knowledge map, a graph structure that stores decomposed unstructured data: extracted entities and relationships as well as observations from source documents. Knowledge maps are designed to capture as much of the nuance and context in the original data as possible, so as to enable accurate processing downstream by a large language model (LLM). This transparent, step-by-step workflow promotes trustworthiness and transparency throughout the analytics process.
The simple story below illustrates how a knowledge map for unstructured data retains context that would not be available in a knowledge graph.
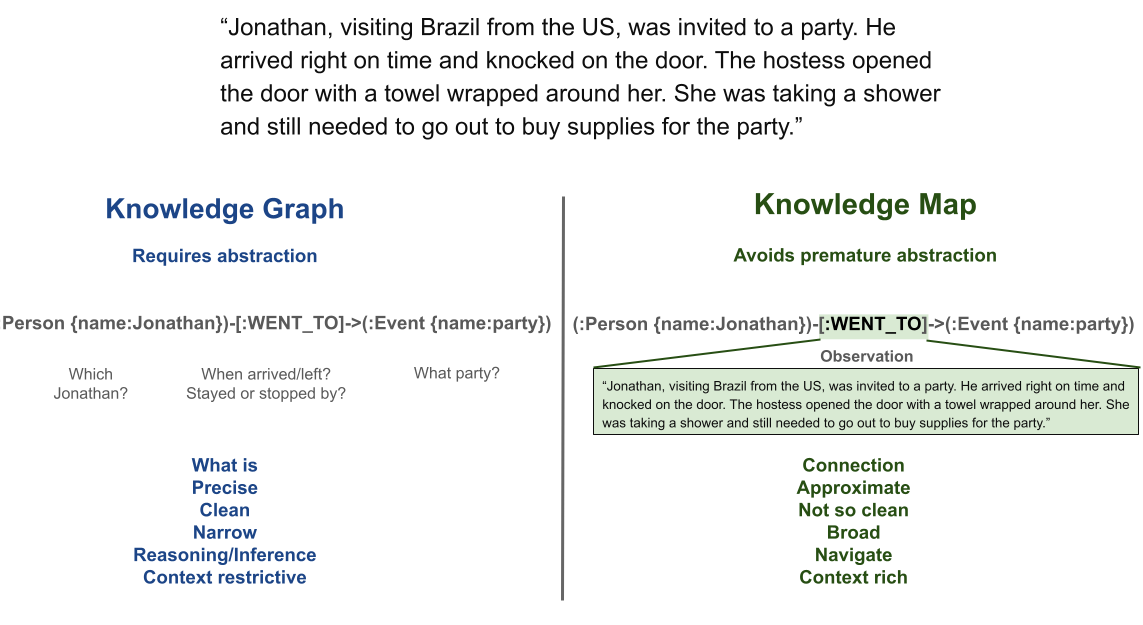
The knowledge graph’s entities and relationships are narrowly and precisely defined. This allows for machine reasoning, semantic search and cross-domain integration. However, context is restricted and this can lead to abstraction that introduces error and uncertainty in downstream analysis.
The knowledge map also represents extracted entities and their connecting relationships. But now, context is retained in observations, chunks of the source documents that relate to the extracted entities, thereby avoiding premature abstraction.
The GraphBI platform and toolkit
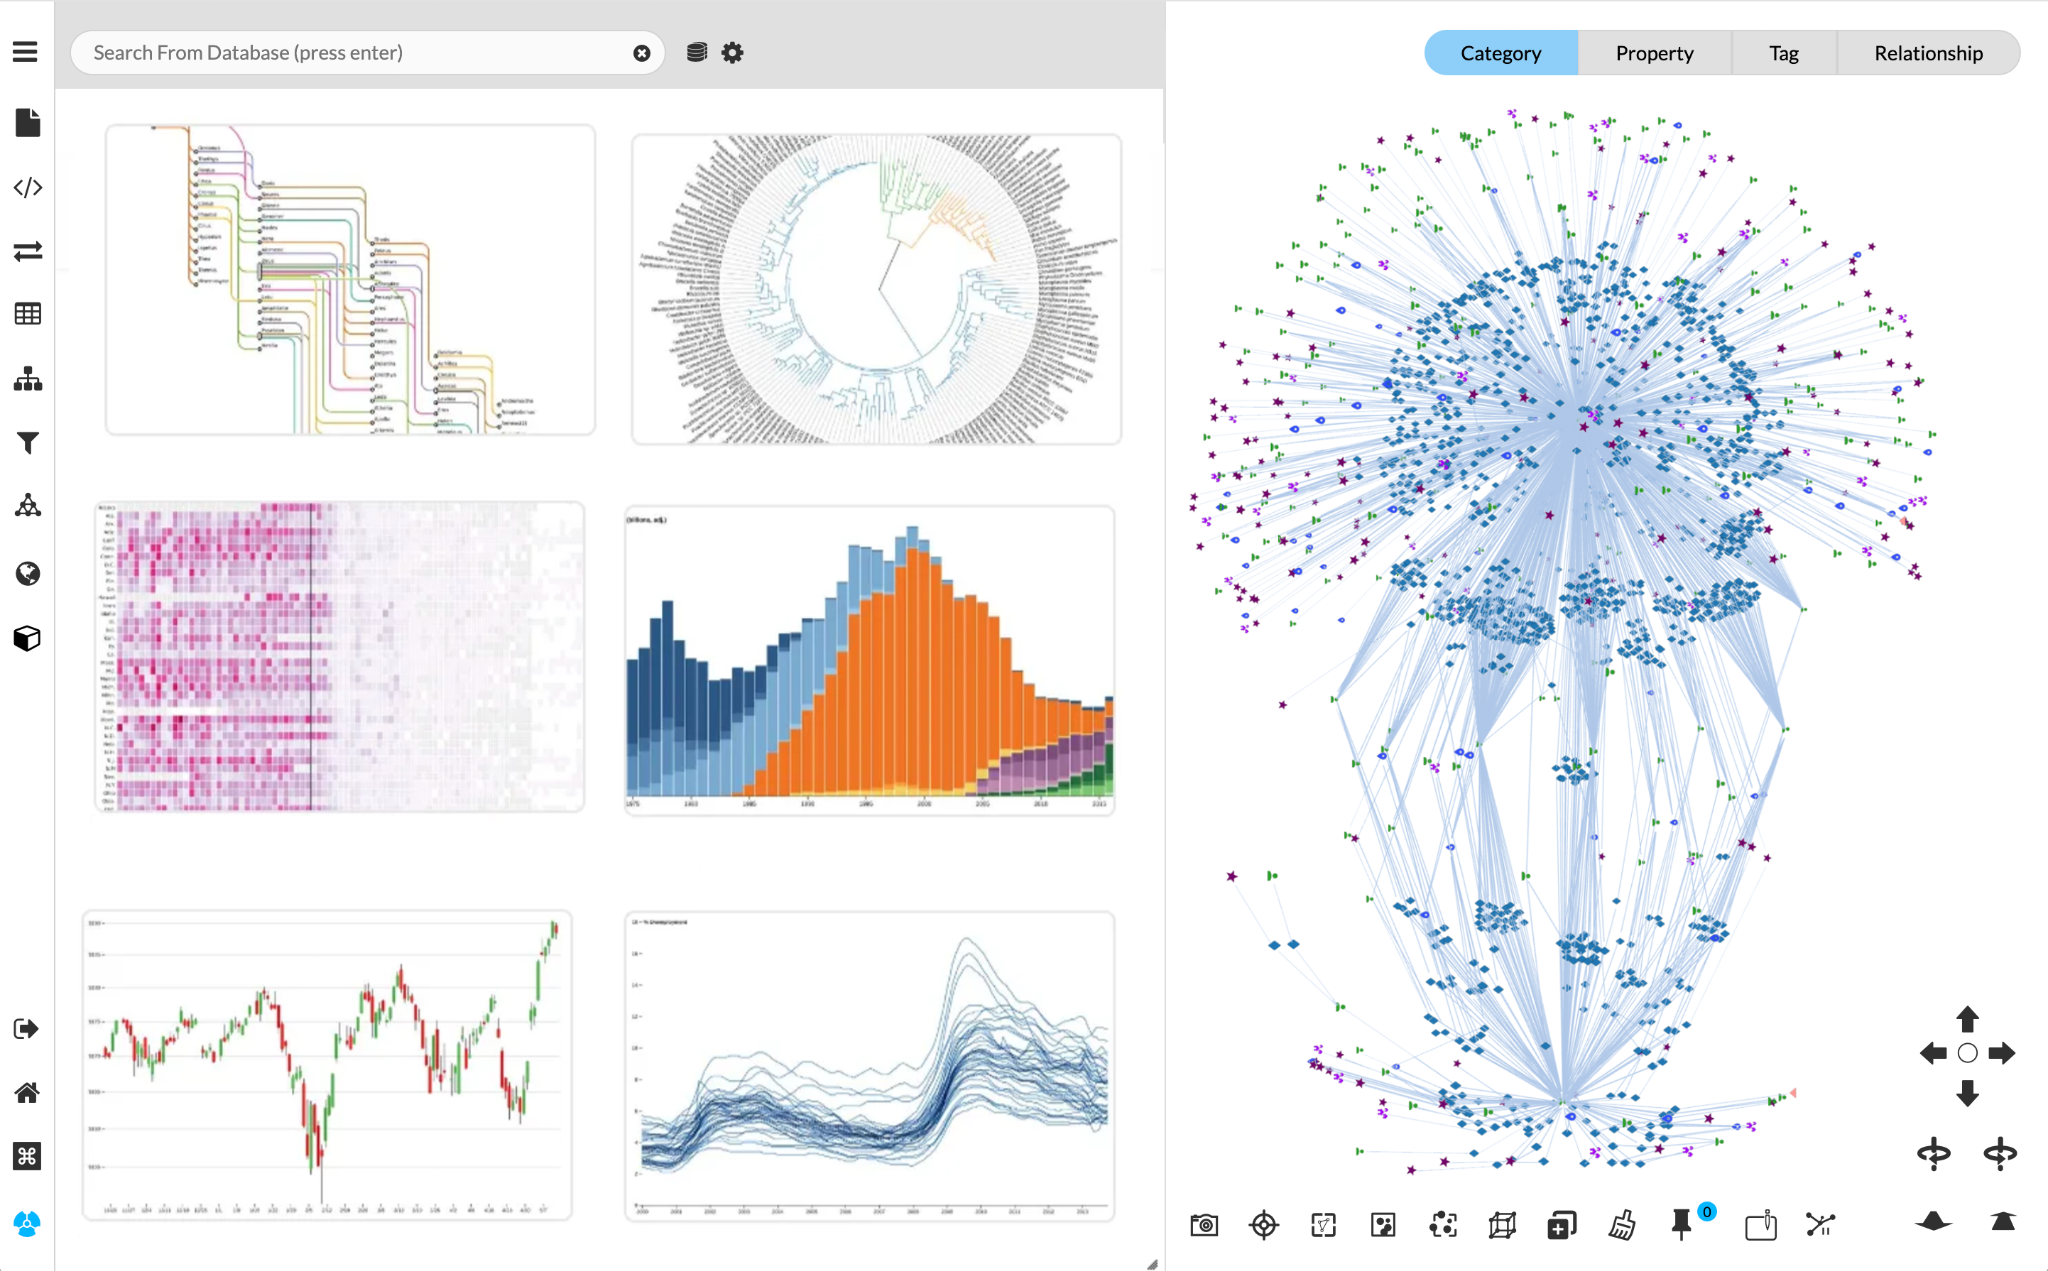
With GraphBI, exploring a knowledge map from different perspectives and communicating key results becomes relatively straightforward. Its robust visual language and toolkit makes it possible to discover and work with patterns of interest. A GraphBI approach then becomes an aid to thinking, extending human capabilities for pattern recognition and lowering barriers to iterative exploration.
The GraphBI toolkit includes:
1. Search
Basic keyword search through to semantic search supported by vector embeddings is supported. Additional graph indexing enables high context, large scale graph search. This includes expanding entities through their relationships, path finding, and searching on graph algorithm results.
2. Operators
GraphBI is designed to support a fundamentally iterative process of engaging with data. Initial results inevitably spark new questions which are often best investigated by reducing complexity, or by viewing the data from new perspectives. That’s easily possible because unlike the schemas of relational databases, a property graph schema is both flexible and extensible.
Operators that support exploration are of three basic types:
Tabular (Map, Reduce, Filter, Group By). These operators provide processing and analytics for big data, which may be accessed through frameworks like MapReduce or Spark.
Graph (Extract, Link, Shortcut, Map, Aggregate, Filter). These graph-specific operators let you transform multiple tables into property graph formats, and also re-organize a graph to view it from new perspectives.
- Extract. Creates a new entity from a tabulated property, creating new graph nodes and their connecting edges in the process.
- Link. Establishes the equivalence of properties in separate tables, even if they have different labels.
- Shortcut. Creates an explicit inference between two entities connected through an intermediate entity, letting you simplify complex graphs easily.
- Map. Transforms data from one format or internal structure to another using standard or custom functions.
- Aggregate. Adds aggregate property values to nodes or edges, for example, to count the number of edges of a given relationship connected to nodes of a particular entity.
- Filter. Selects and displays nodes with specified property values.
Language (Summary, Decompose, Embedding, Tokenization, Filter, Classification, Q&A, Named Entity Resolution (NER). These operators, available through GenAI, make it possible to work directly with the graphs and observations extracted from unstructured data.
3. Visualization to Drive Decisions
Exploration and decision support is enabled through interactive visual display of the graph. A GraphBI workspace includes:
- Visualization through interactive, flexible styling and layout.
- Visual Analytics such as centrality, clustering, and path finding.
- Dashboard for visualizing charts, timelines, heat maps, and the like.
- Reports
GraphBI for Decision-Making
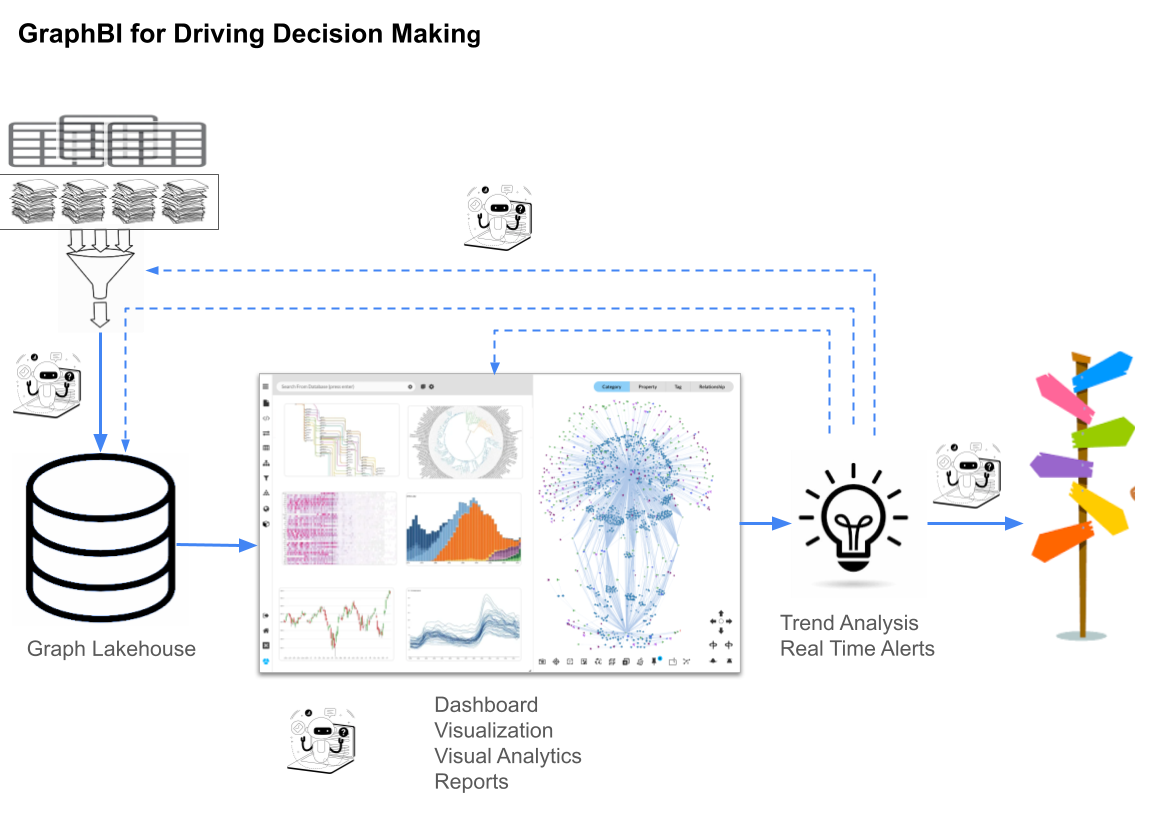
The GraphBI platform is conceived of as a unified front end to visualize and analyze data at any scale. It’s designed to support the entire iterative workflow, from pre-processing to analysis and reporting. This provides for flexible exploration and highly effective fact-based decision-making.
GraphBI also opens up the opportunity to include AI agents at key points, for example, to automate the delivery of information when and where it is needed, and to trigger appropriate communications such as status reports and automatic alerts.
Conclusion
Realizing the value of the data maintained in cloud-based data lakehouses is an ongoing challenge, especially since an estimated 80% of it is unstructured. GraphBI provides a way forward that uniquely surfaces business insights by effectively incorporating all types of data.
An approach combining GenAI for extraction of knowledge maps from unstructured data with graph-enabled business intelligence (GraphBI) unlocks access to largely untapped information. A GraphBI platform provides iterative exploratory analysis of knowledge maps through BI-focused graph grammar and tools, and this promotes rapid fact-based decision making.
Learn more by contacting us today: kineviz.com/contact