
Improve crime investigations with effective visualization
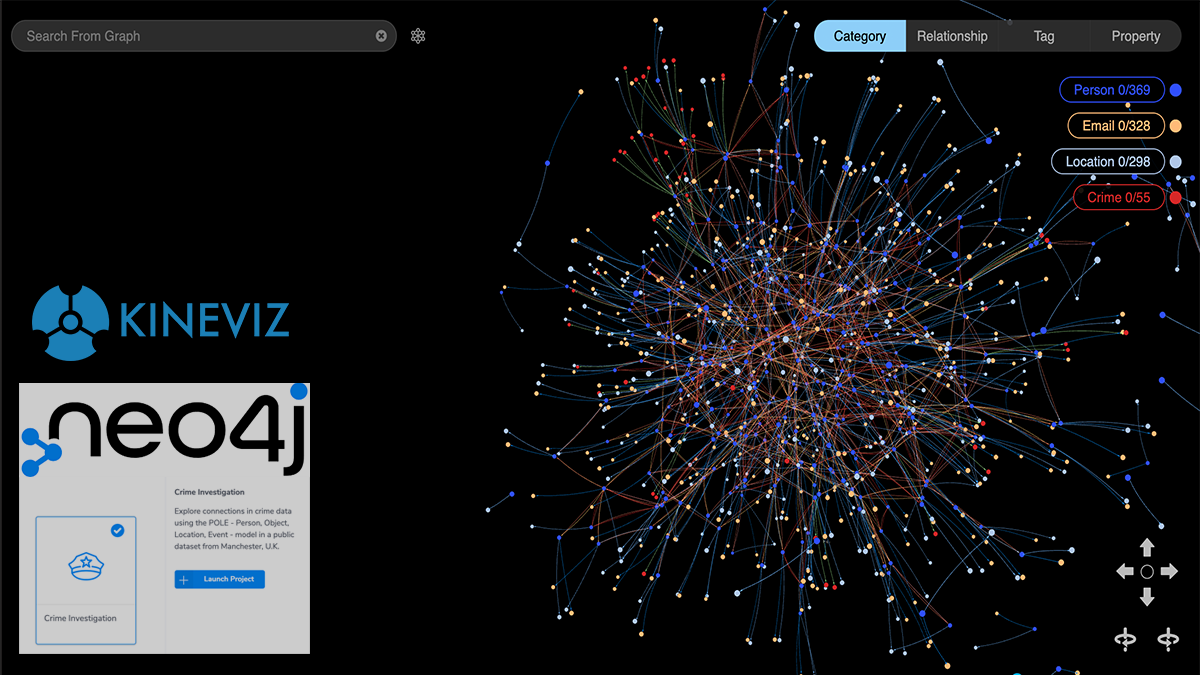
Over the last fifteen years, the digital intelligence community has been challenged with rapid technological developments and growing heterogeneous data. As a response, software providers have developed graph technology, which has emerged as a practical tool for making sense of connected data and enabling investigators to work with their data more intuitively.
This blog will dive into how graphs empower digital investigations through visualization, starting with Neo4j’s pre-built sandbox and its underlying POLE (Person, Object, Location, Event) data model. This graph story will highlight how digital investigations can be driven by effective visualization.
Neo4j’s crime investigations sandbox
As a follow-on to our credit card fraud example, we’ll explore the crime investigation Neo4j sandbox to tackle how to implement effective visualization practices for investigators. This sandbox provides data and a schema that models security and policing-type use cases as categories of data and their explicit relationships. Its geospatial and temporal attributes make it a powerful example upon which to try investigative graph analysis.
Since Neo4j’s sandbox comes with a pre-built schema, it lets us get right to the visualization aspect. Of course, you could build a similar model from scratch in GraphXR by simply mapping a CSV, but that‘s for another blog post. For now, we’ll skip to the visualization where we can channel different views that address several questions of the POLE model below.
Quick tip:
* To pull the above Neo4j schema into GraphXR, you can use Cypher on GraphXR's query panel and run the following query:
call db.schema.visualization()
The POLE model
Let’s review what the crime investigation sandbox provides using Neo4j’s Desktop Browser. Here, you can pull the POLE model which shows the basic entities within the dataset: Person, Objects, Locations, and Events. The sandbox data, provided by data.gov.uk, includes crimes, time (by month), and locations in the Greater Manchester, UK area since August 2017. It is important to note that all persons are fictionalized and any similarity to real persons or events is unintentional.
Nonetheless, POLE is a universal model for investigative use cases in law enforcement and public security. As Neo4j states, the POLE graph “generates insights into patterns of behavior and incidents, which can inform new approaches and enable a more targeted use of limited resources.”
The Neo4j sandbox supplied with pre-built projects empowers graph enthusiasts to explore the benefits of traversing large amounts of connected data in the browser and in just a few minutes. Learn more at https://neo4j.com/sandbox/
Strategy
With the POLE model, we can look at key players associated with crime events and frame our analysis across time and place. Our goal is to gain visibility on the geospatial and temporal repercussions of certain crimes across the UK, while being able to link the people behind these investigations — but in a high-dimensional view.
It is important to note that when working with large disparate data, one visualization — or view — is unable to communicate everything we want to know. We must create a series of views to tackle different questions, using queries and data transforms such as filter and link analysis to unveil key players and locations of concern.
Pull event and location data into GraphXR
A simple start to analyzing the POLE model is to pull in event and location data into GraphXR. We focused on layering crime data on top of locations, to produce high-dimensional views that address questions such as:
“What types of crime impact the region?”
“How many crimes have occurred by location and when?”
“Which officers lead investigations on crimes in multiple locations?”
GraphXR view of Locations by crime Type
To do this we’ll:
* Query the Neo4j data in GraphXR to pull in all Location nodes. In GraphXR’s Query panel and Cypher tab, enter the following Cypher query:
MATCH (l:Location)<-[:OCCURRED_AT]-(c:Crime)
RETURN *
* Right click and select Expand, to add data connected by the OCCURRED_AT relationship. This will include all nodes in the Crime category.
* Under the Transform panel, use Merge to combine Crime nodes by a shared property, Crime Type, to see Locations by Crime Type.
This view leverages 3D force layout to show how some locations are shared between 2 or more crime types. With node size scaled to a centrality graph algorithm, we can notice which crime types are the most prevalent prior to having geospatial attributes mapped.
Add geospatial & temporal analysis
The map feature of GraphXR lets us use lat/lng properties in the location nodes to drop data on a 2D map. We can then take note of which types of crime are concentrated in one area, or dispersed throughout the region by showing relative incidence of different crime types on the z-axis.
Documented crime data also include dates which allows us to add the dimension of time.
For another visualization, we can pivot our analysis to look at crimes by date and location. We can do this by pulling in locations, then expanding upon the relationships to show crimes, and the police officers that responded to or investigated each specific crime.
The following step-by-step video shows how quickly you can pull together a sophisticated visualization of data on distribution of crime and persons handling those investigations in the 3D space.
GraphXR layouts:
* Go to the Geometric tab under Layout and under Distribution select Order by Property.
* Choose crime as the Category and date as the Property
* Check the date checkbox below and next to Distribution click Z. Adjust spacing by checking the Spread Out checkbox and altering the Range or use Shift to move the whole axis up or down.
More investigative details such as identifying potential communities of criminals or finding vulnerable populations in the graph could be added to the graph model, and layered on top of this basic framework. Neo4j sandbox provides a range of Cypher queries to enhance this analysis that you can check out here.
Let us know how effective visualizations are working to empower your investigations. Visit our GraphXR learning resources and/or contact us for a free demo to get started.