
Using GraphXR Agent to create a graph and dashboard from CSV
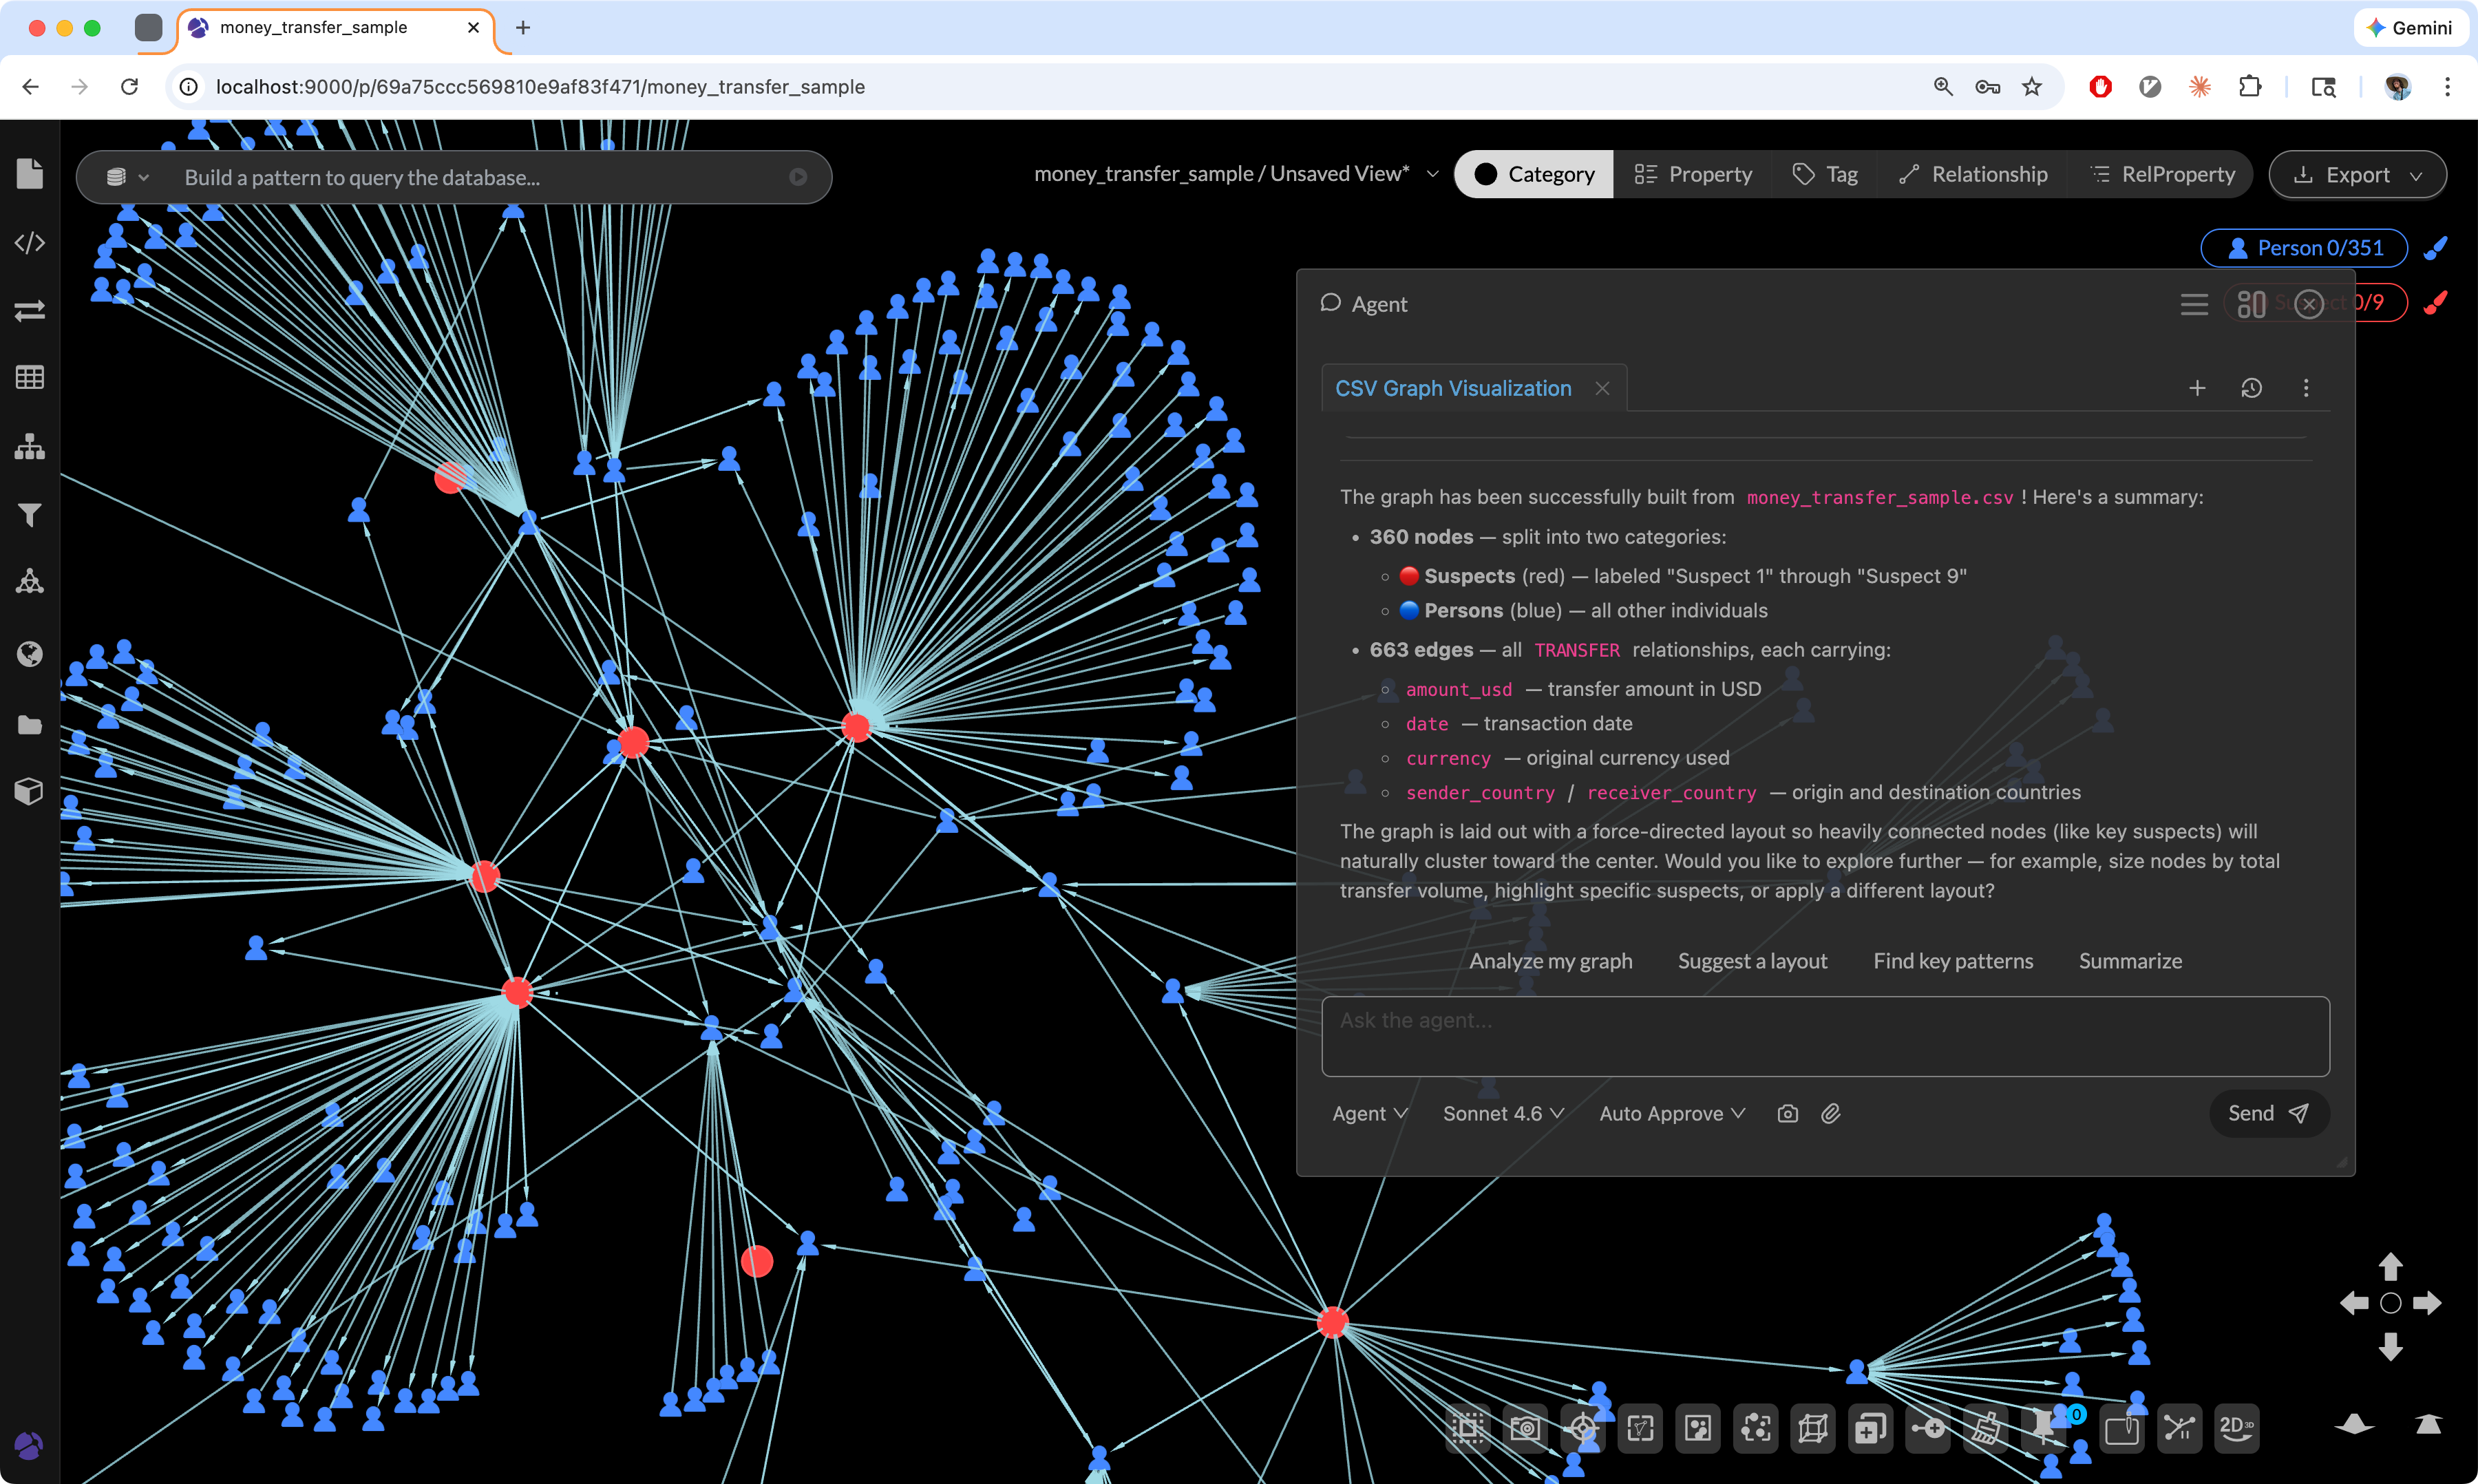
It’s easy to use GraphXR’s built-in Agent to create graphs and dashboards from a CSV file! (currently a limited access feature. Contact us for access.)
1. Upload money_transfer_sample.csv to GraphXR
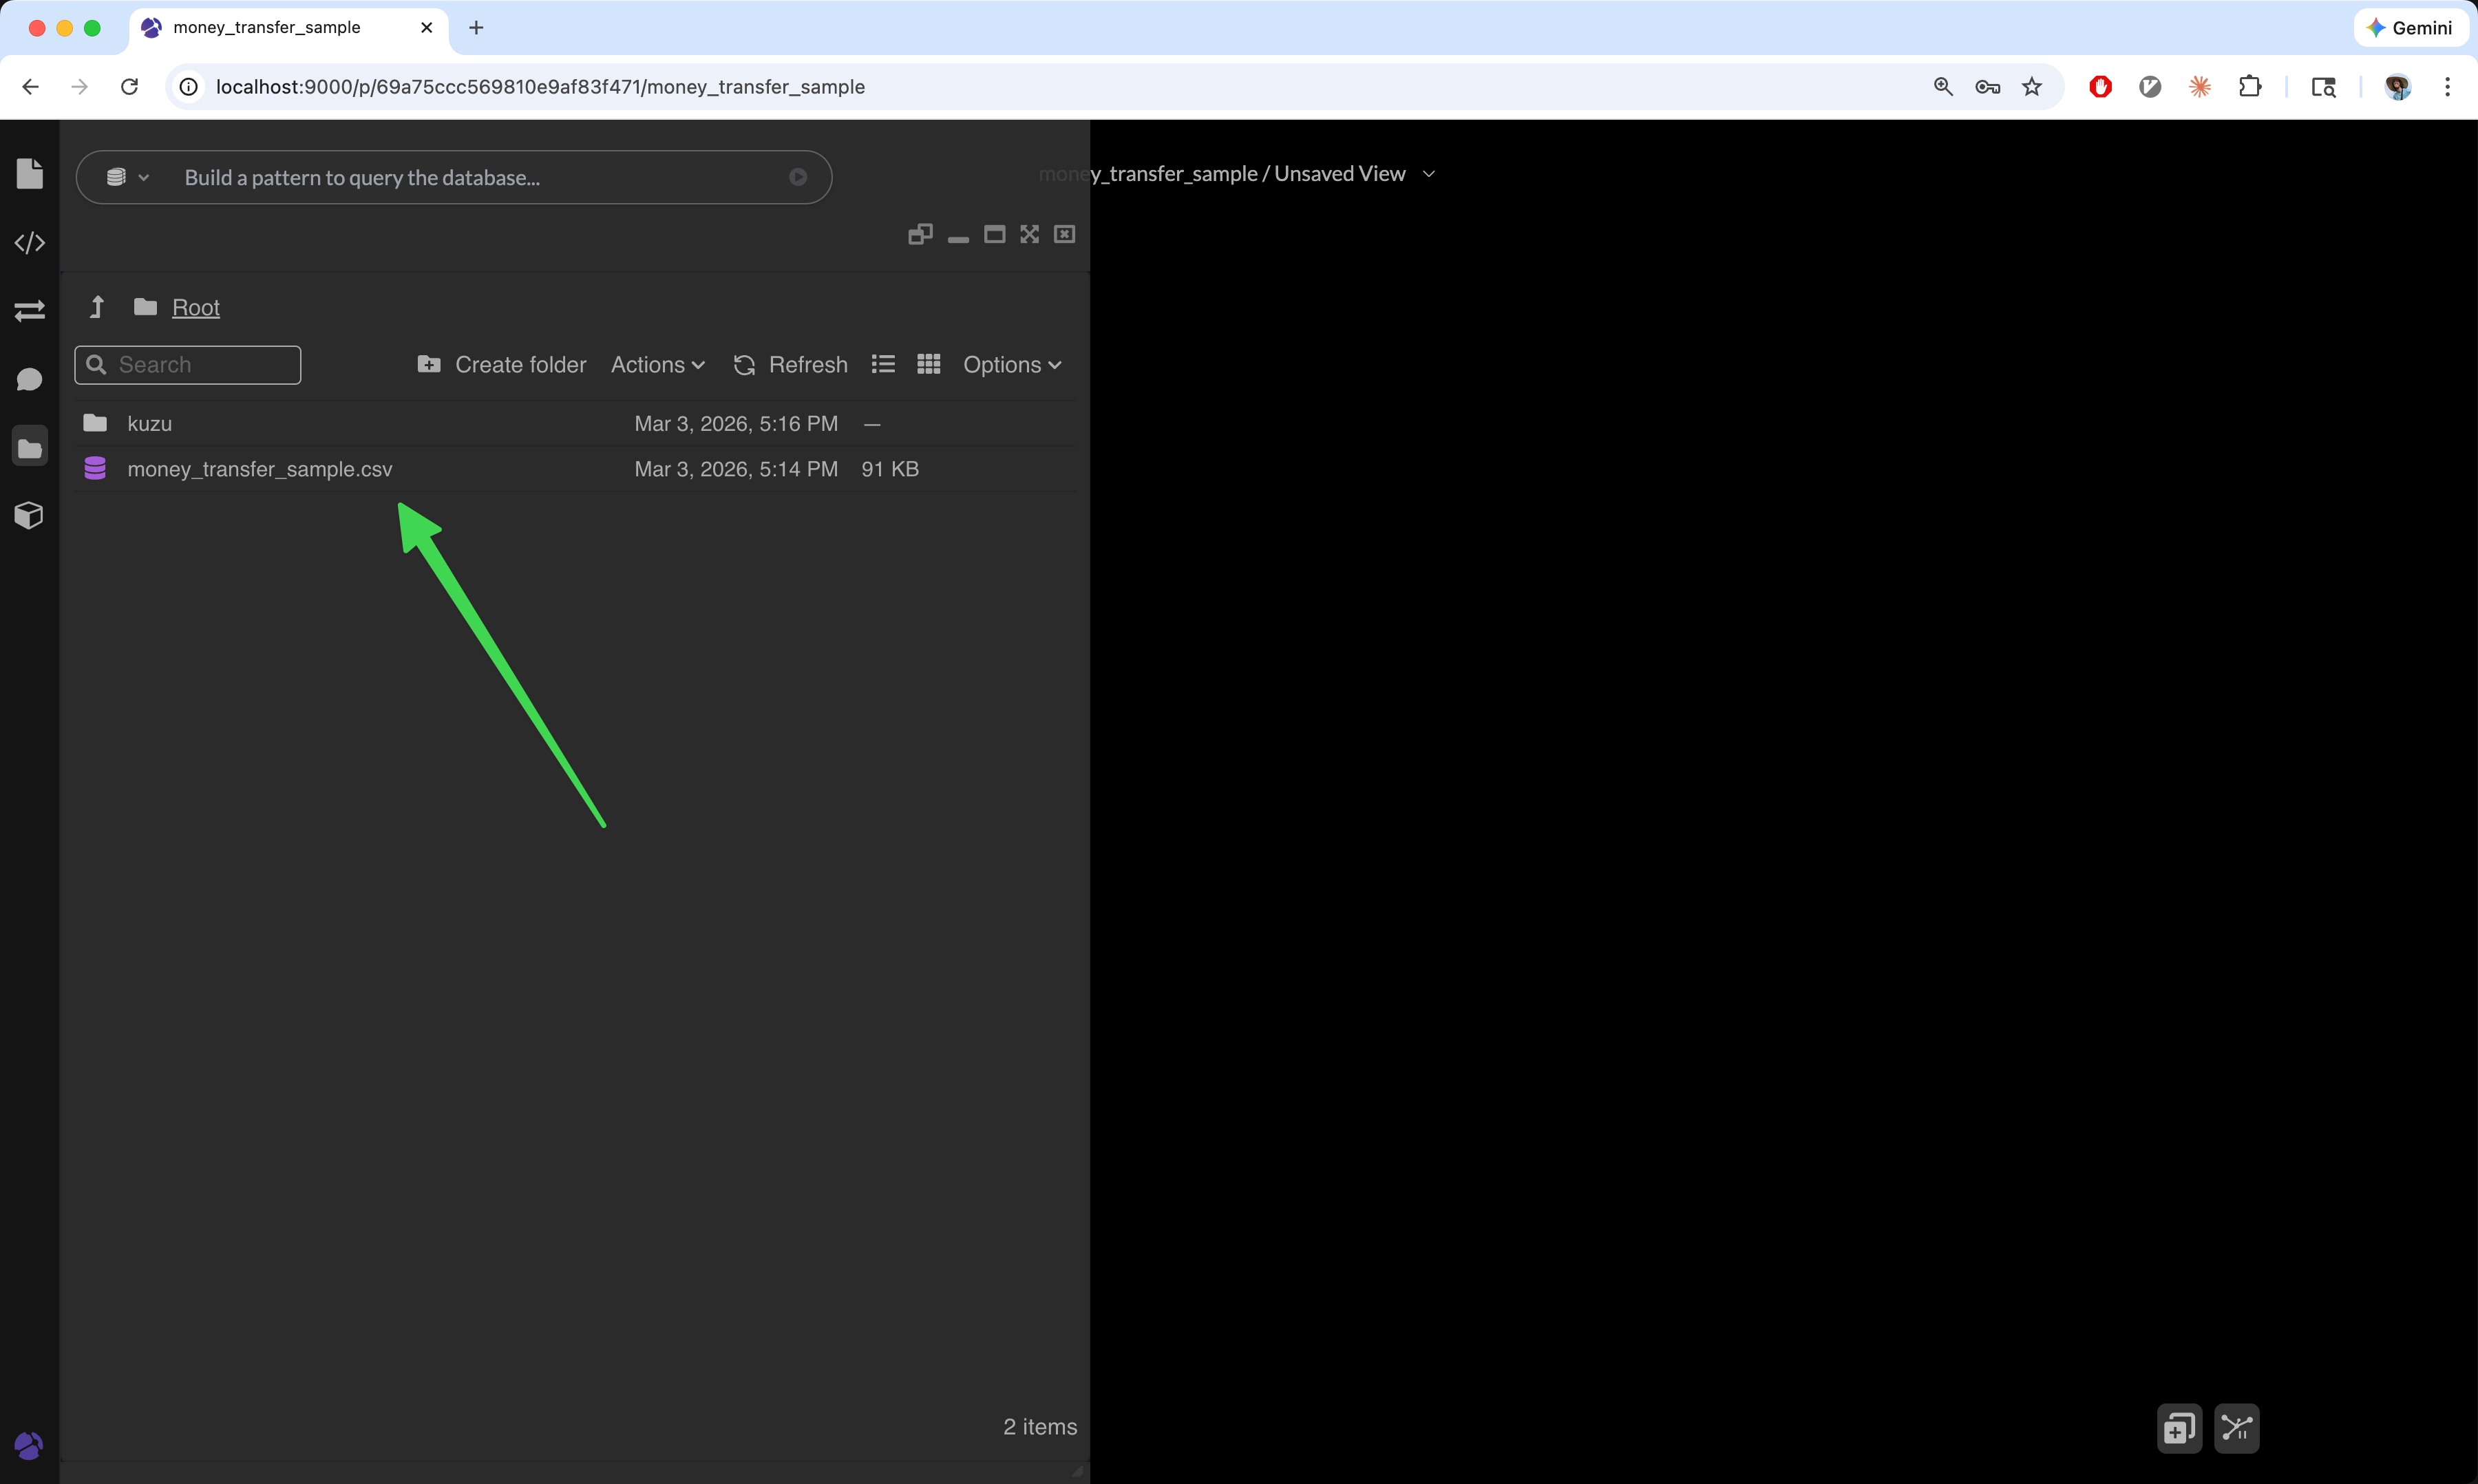 money_transfer_sample.csv is uploaded to the project
2. Prompt GraphXR Agent: `create a simple graph from money_transfer_sample.csv`
I used Claude Sonnet 4.6 to generate a simple graph from the csv file, using GraphXR API.
Save the canvas to the Internal Data Store so we can query it with Cypher.
3. Prompt GraphXR Agent `Create a Grovebook with 3 buttons to run insightful cypher queries.`
Let’s create a custom dashboard to run Cypher queries on the Internal Data Store.
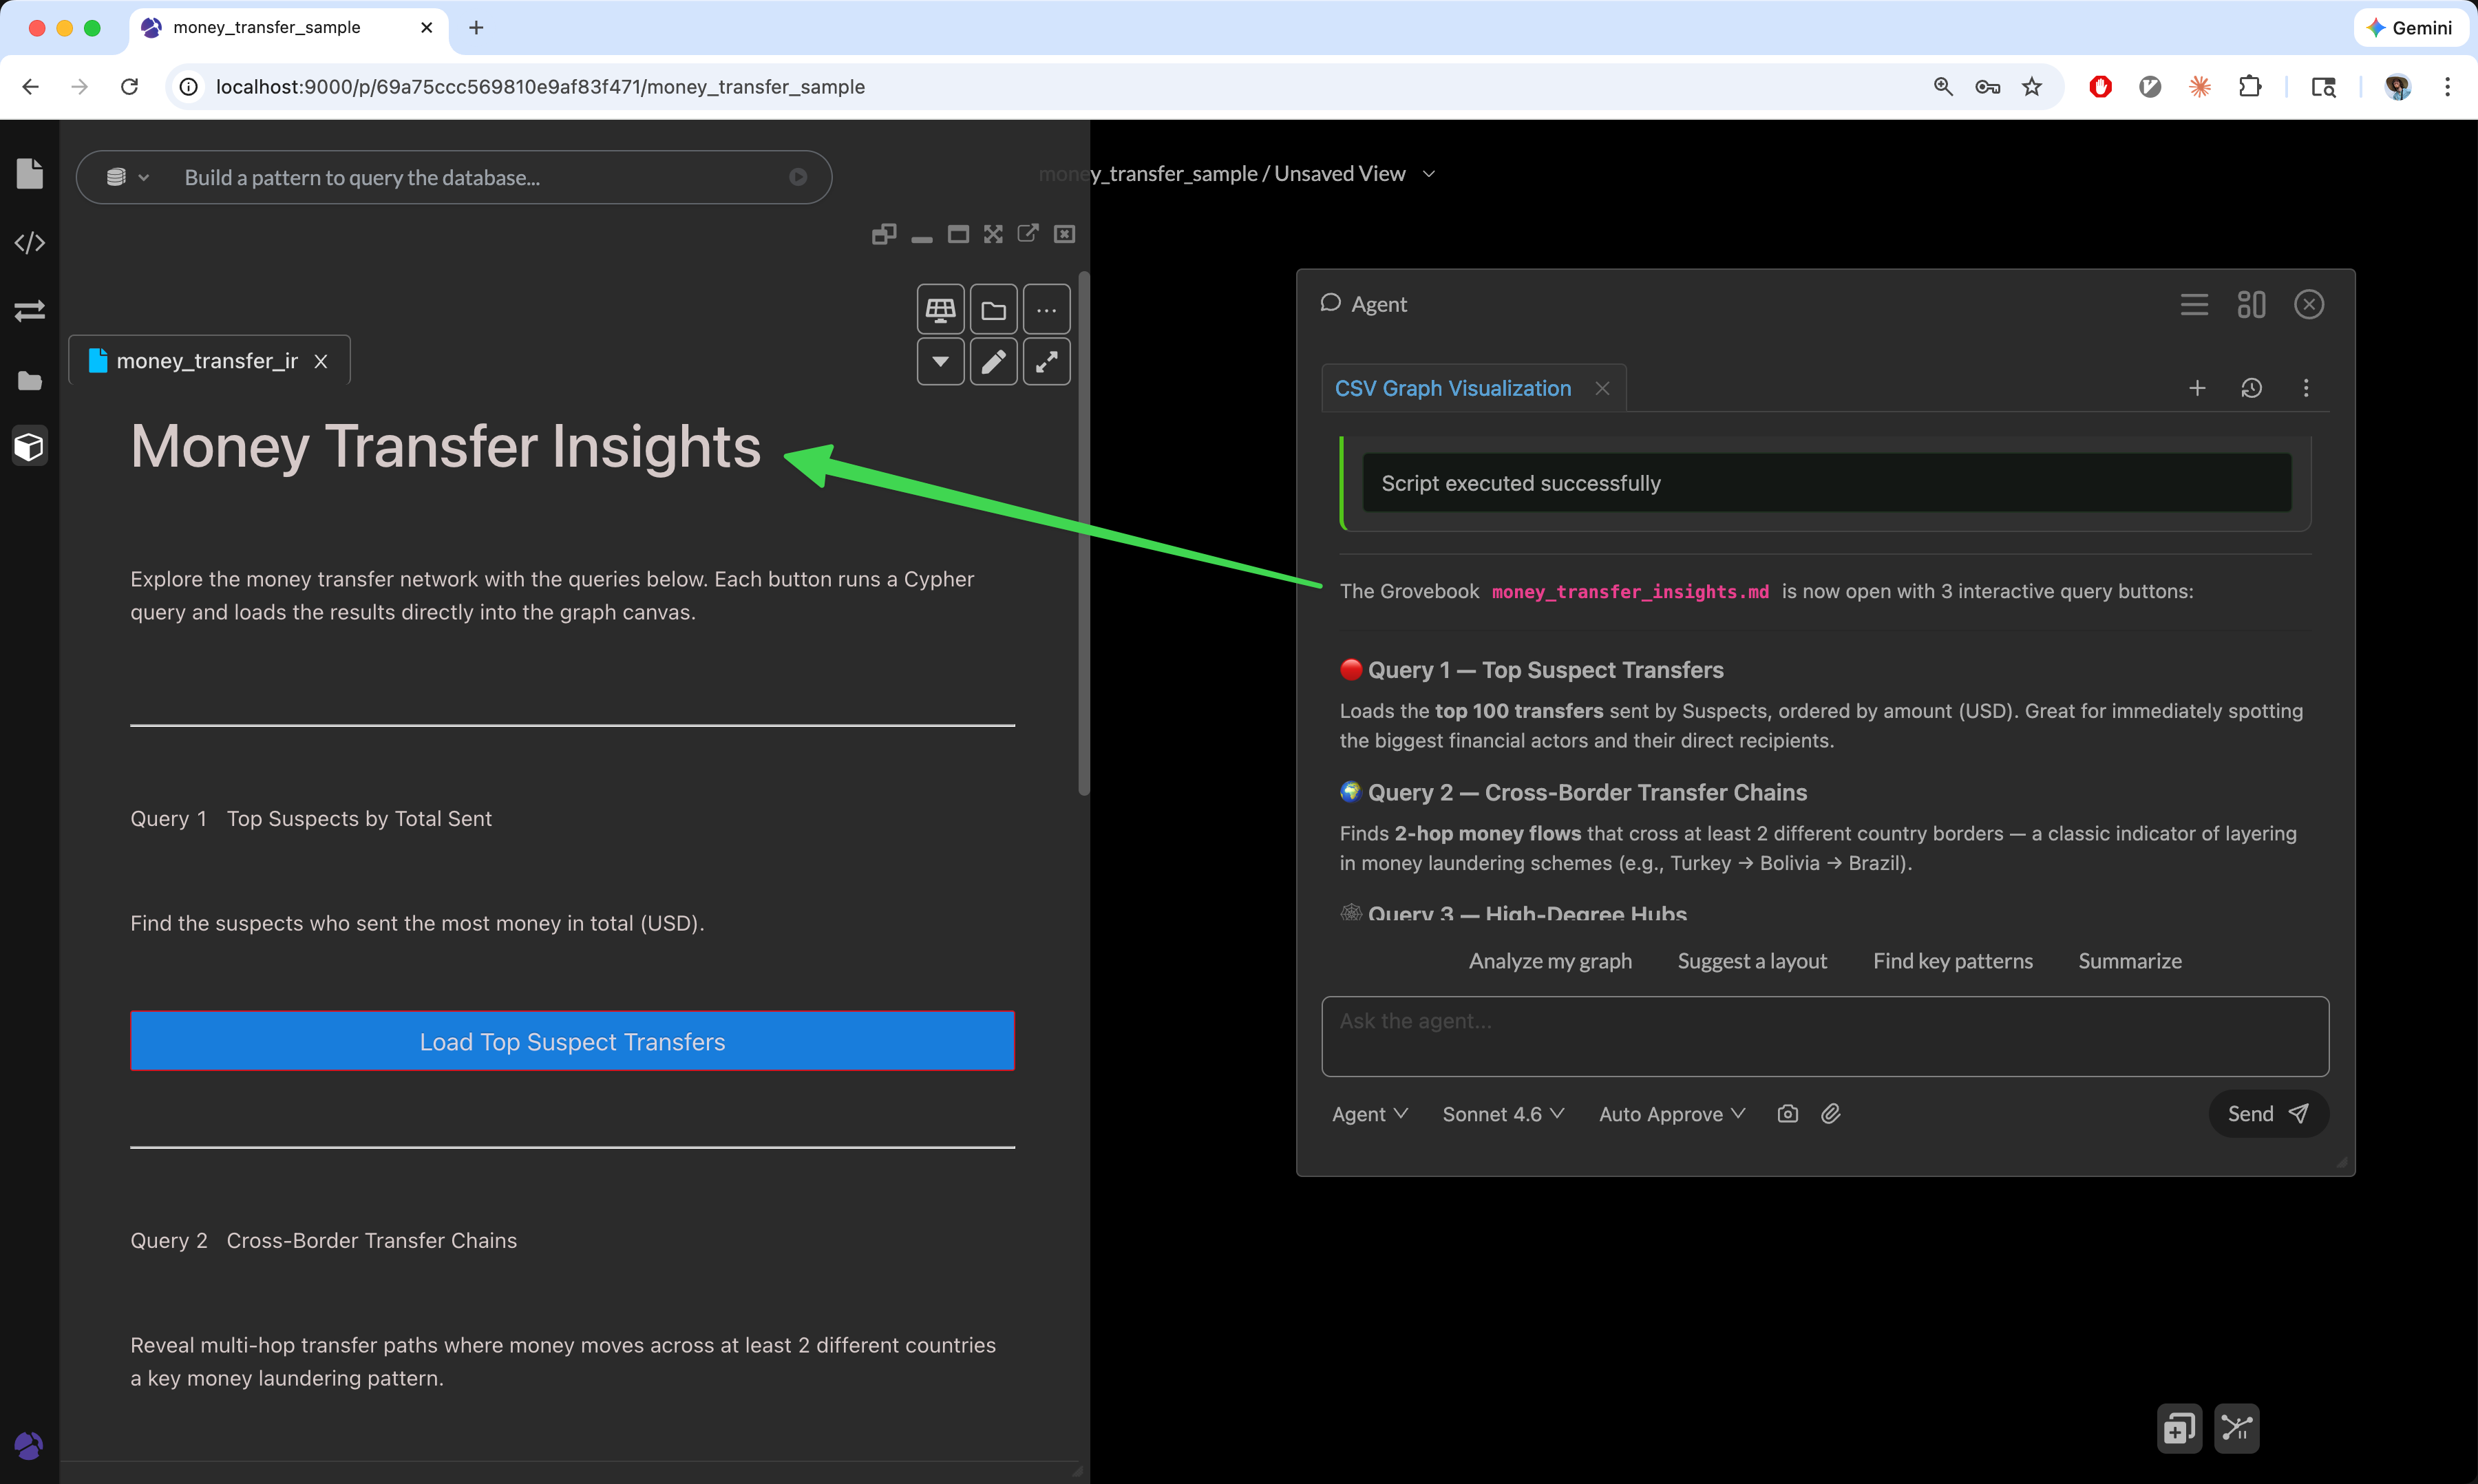 Generate a Grovebook using GraphXR Agent
The button 👆🏻 above runs the following Cypher query, which fetches the first 100 money transfers ordered by amount_usd in descending order.
MATCH (s:Suspect)-[t:TRANSFER]->(receiver)
RETURN s, t, receiver
ORDER BY t.amount_usd DESC
LIMIT 100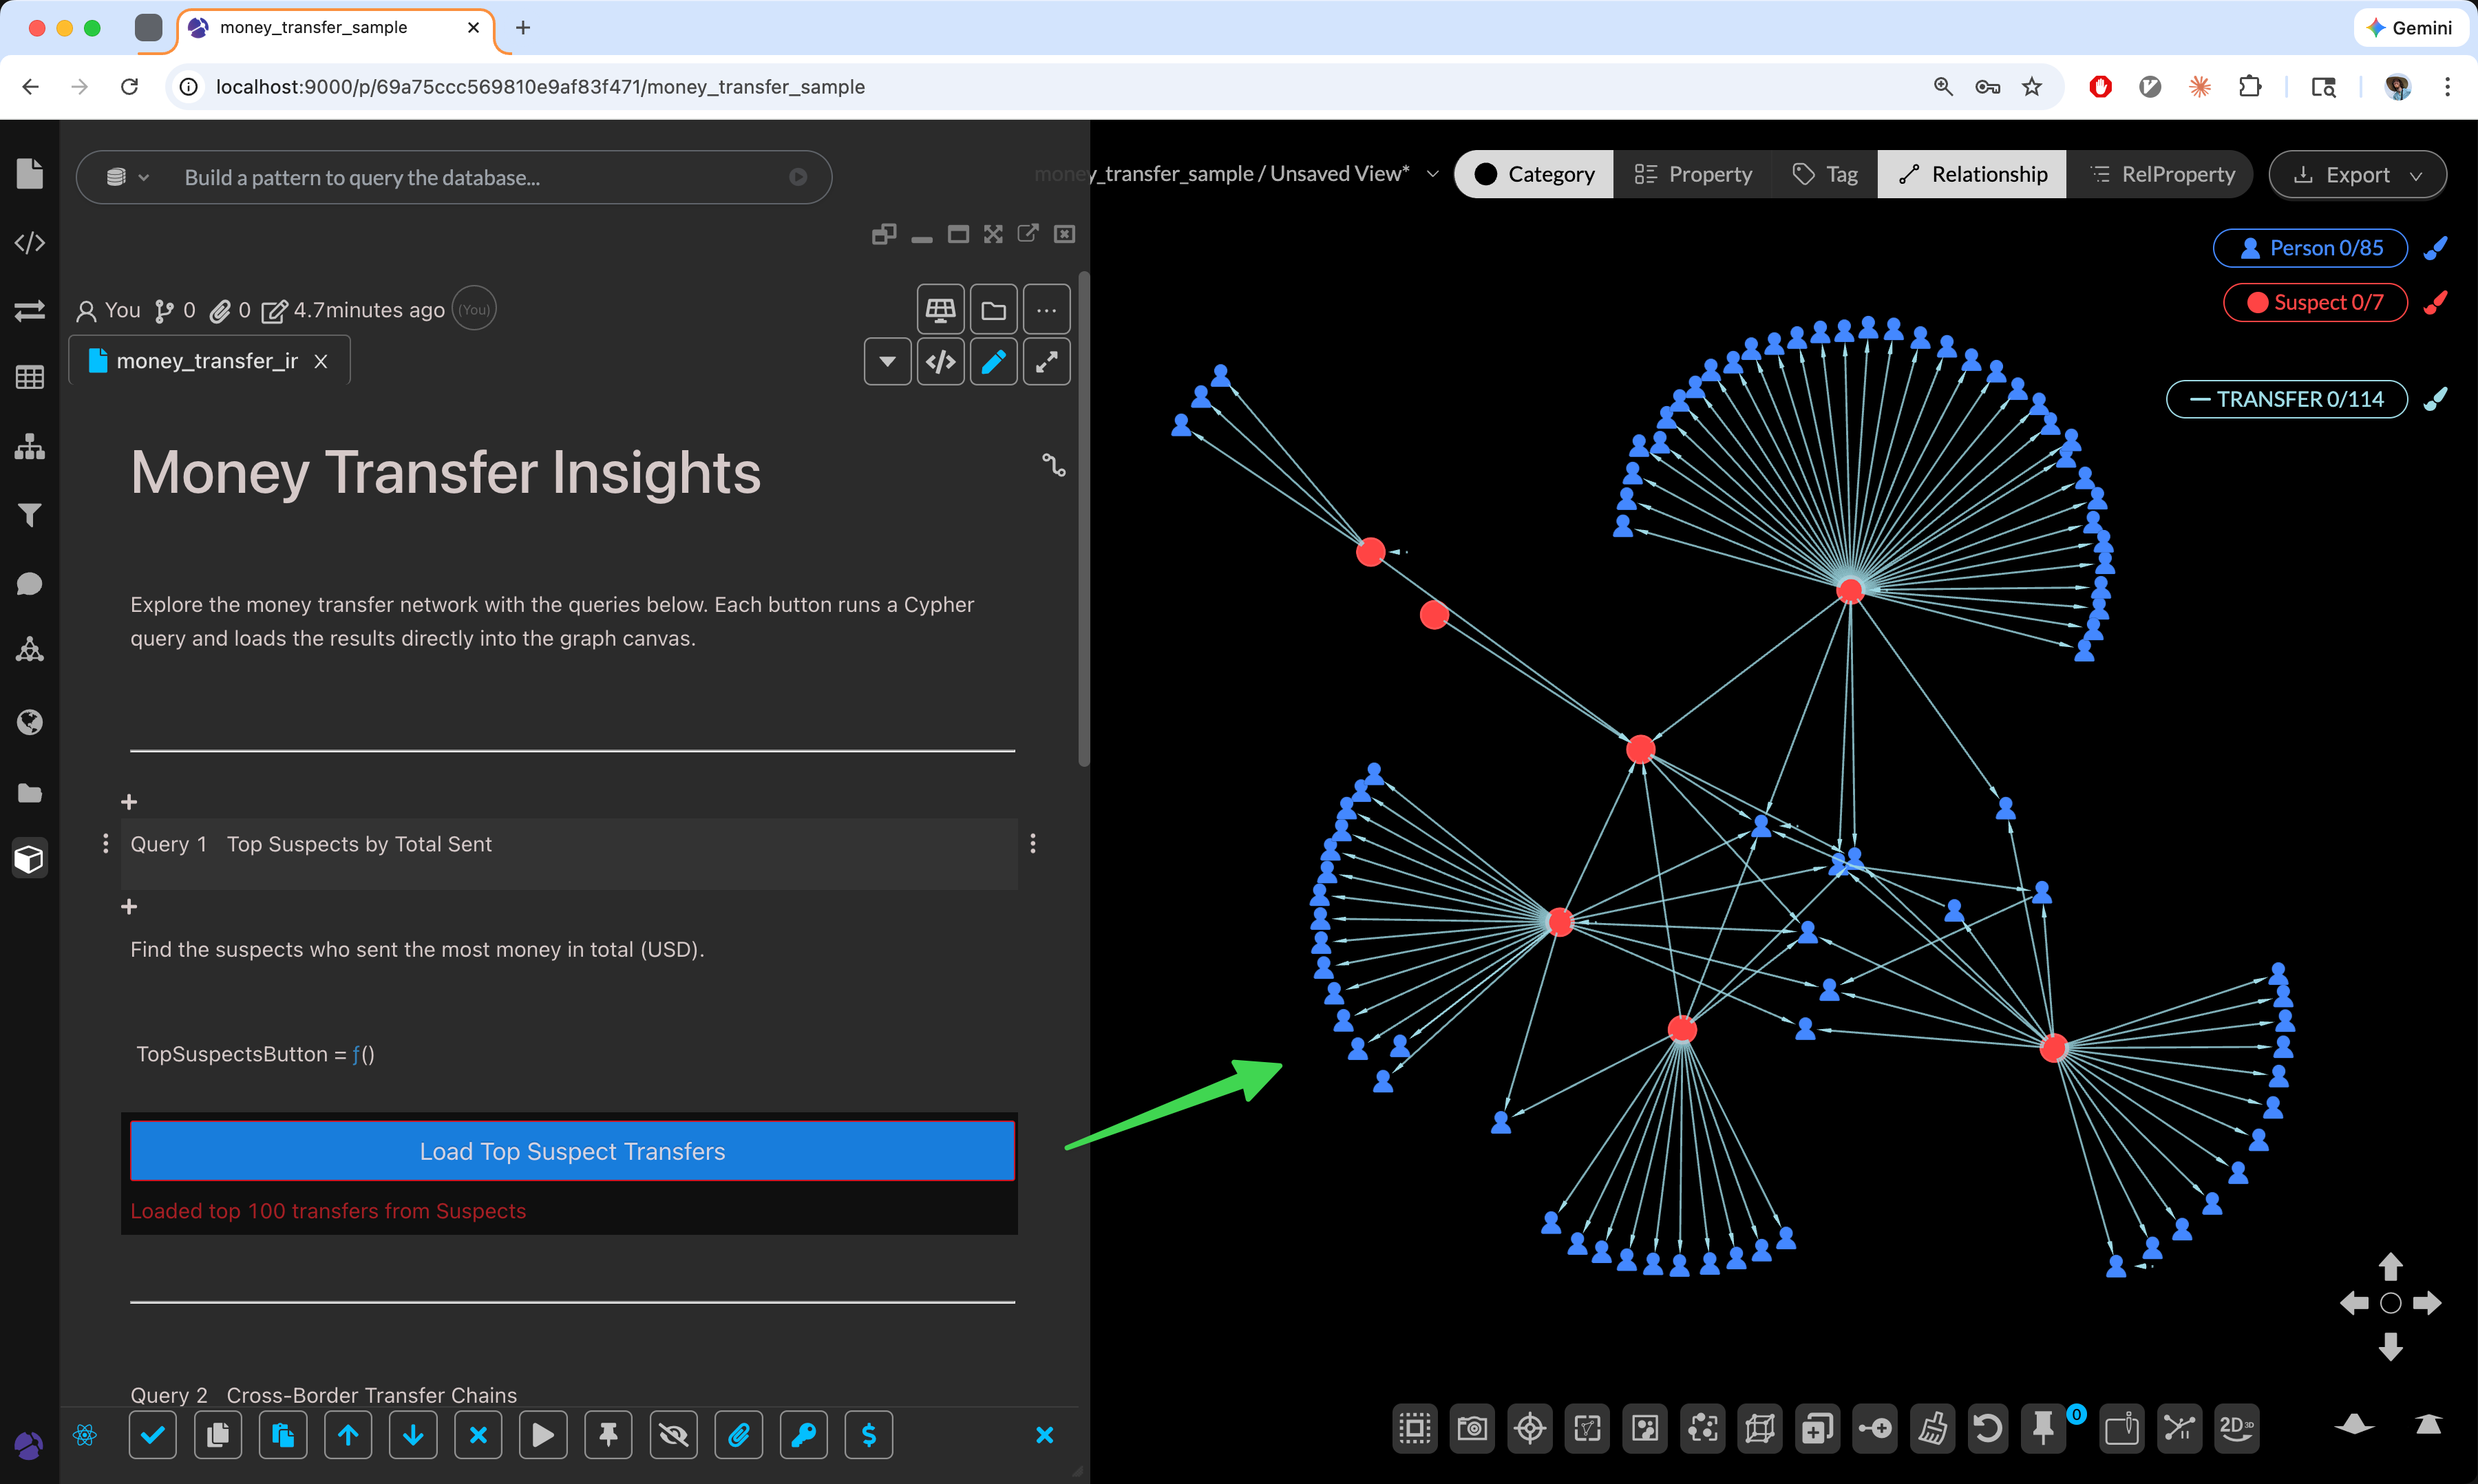 The result of “Load Top Suspect Transfers”
I clicked on the button and got the above graph.
Thanks for reading! Kineviz GraphXR is a natural choice for connecting your data, visualizing it, and sharing the results with others.