
Vibe coding a Jira dashboard in GraphXR with Cursor
It’s easy to drown in a sea of Jira tickets. Laying them out on a 3d canvas helps us stay afloat, because we can visually organize tickets by assignee, status, and priority. So late one evening, I vibe coded a Jira dashboard in my favorite knowledge graph authoring tool, GraphXR. (spoiler, I build GraphXR at work)
Here’s a screenshot tour:
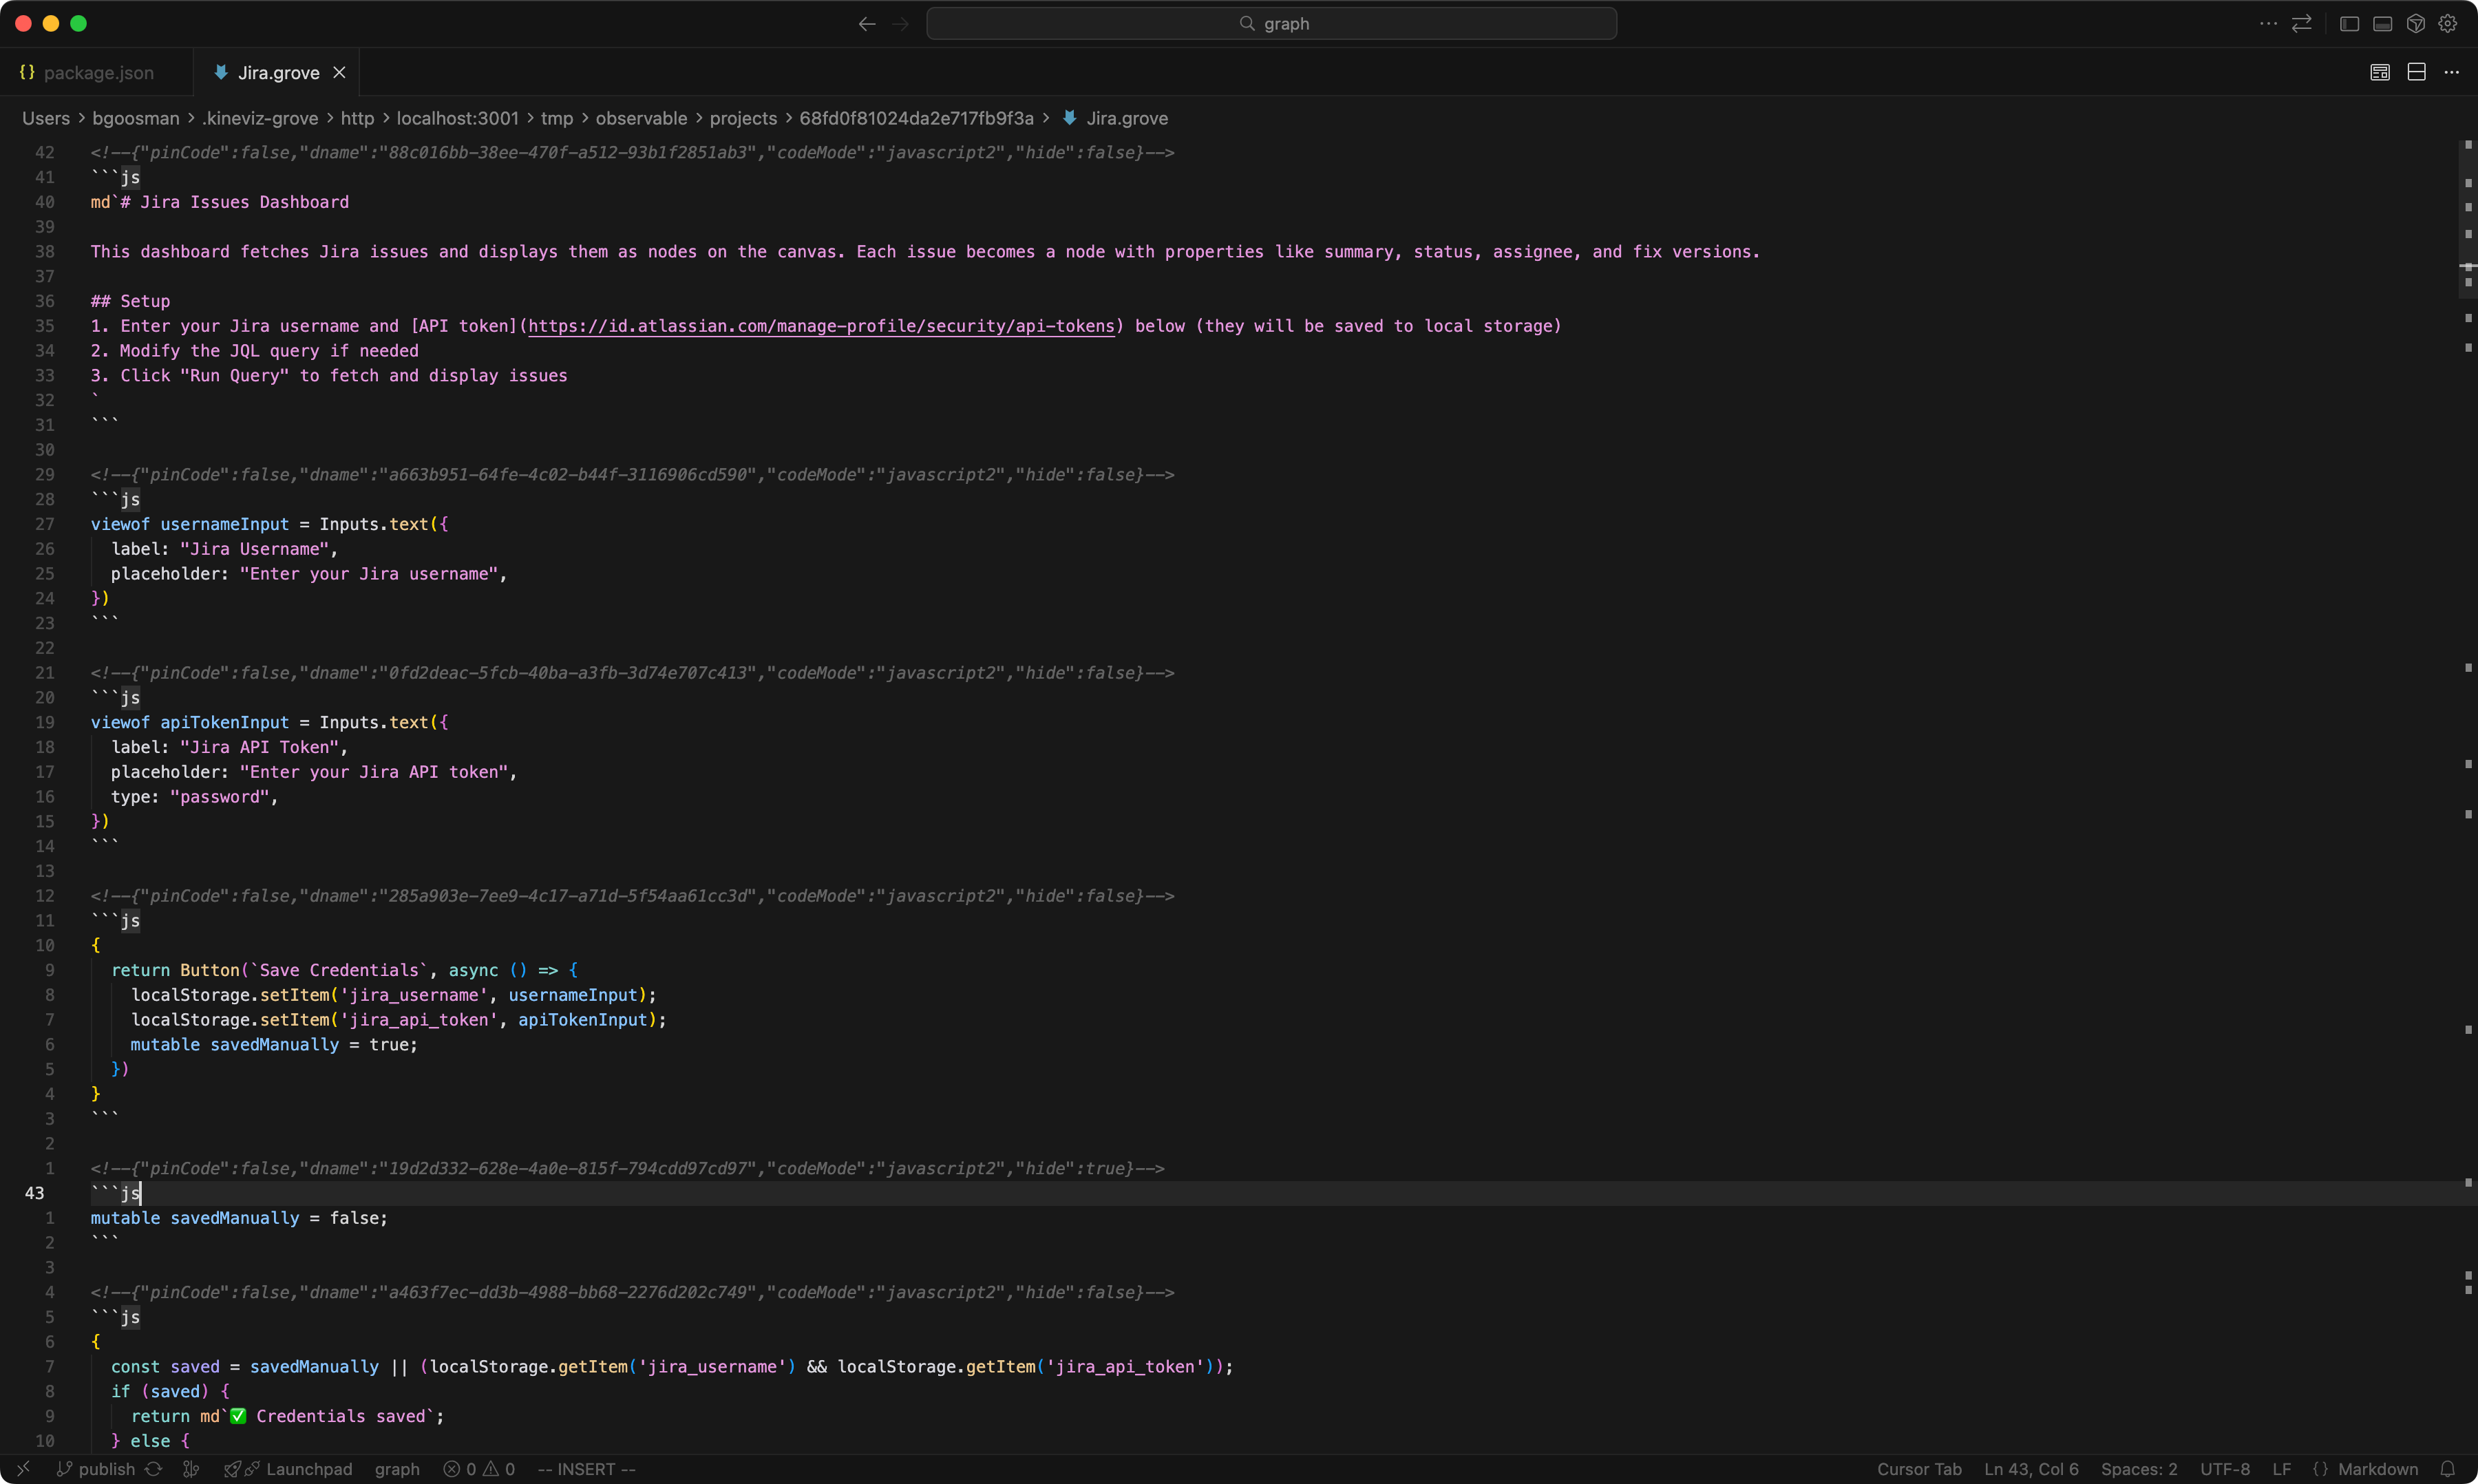 Editing the Jira dashboard in Cursor
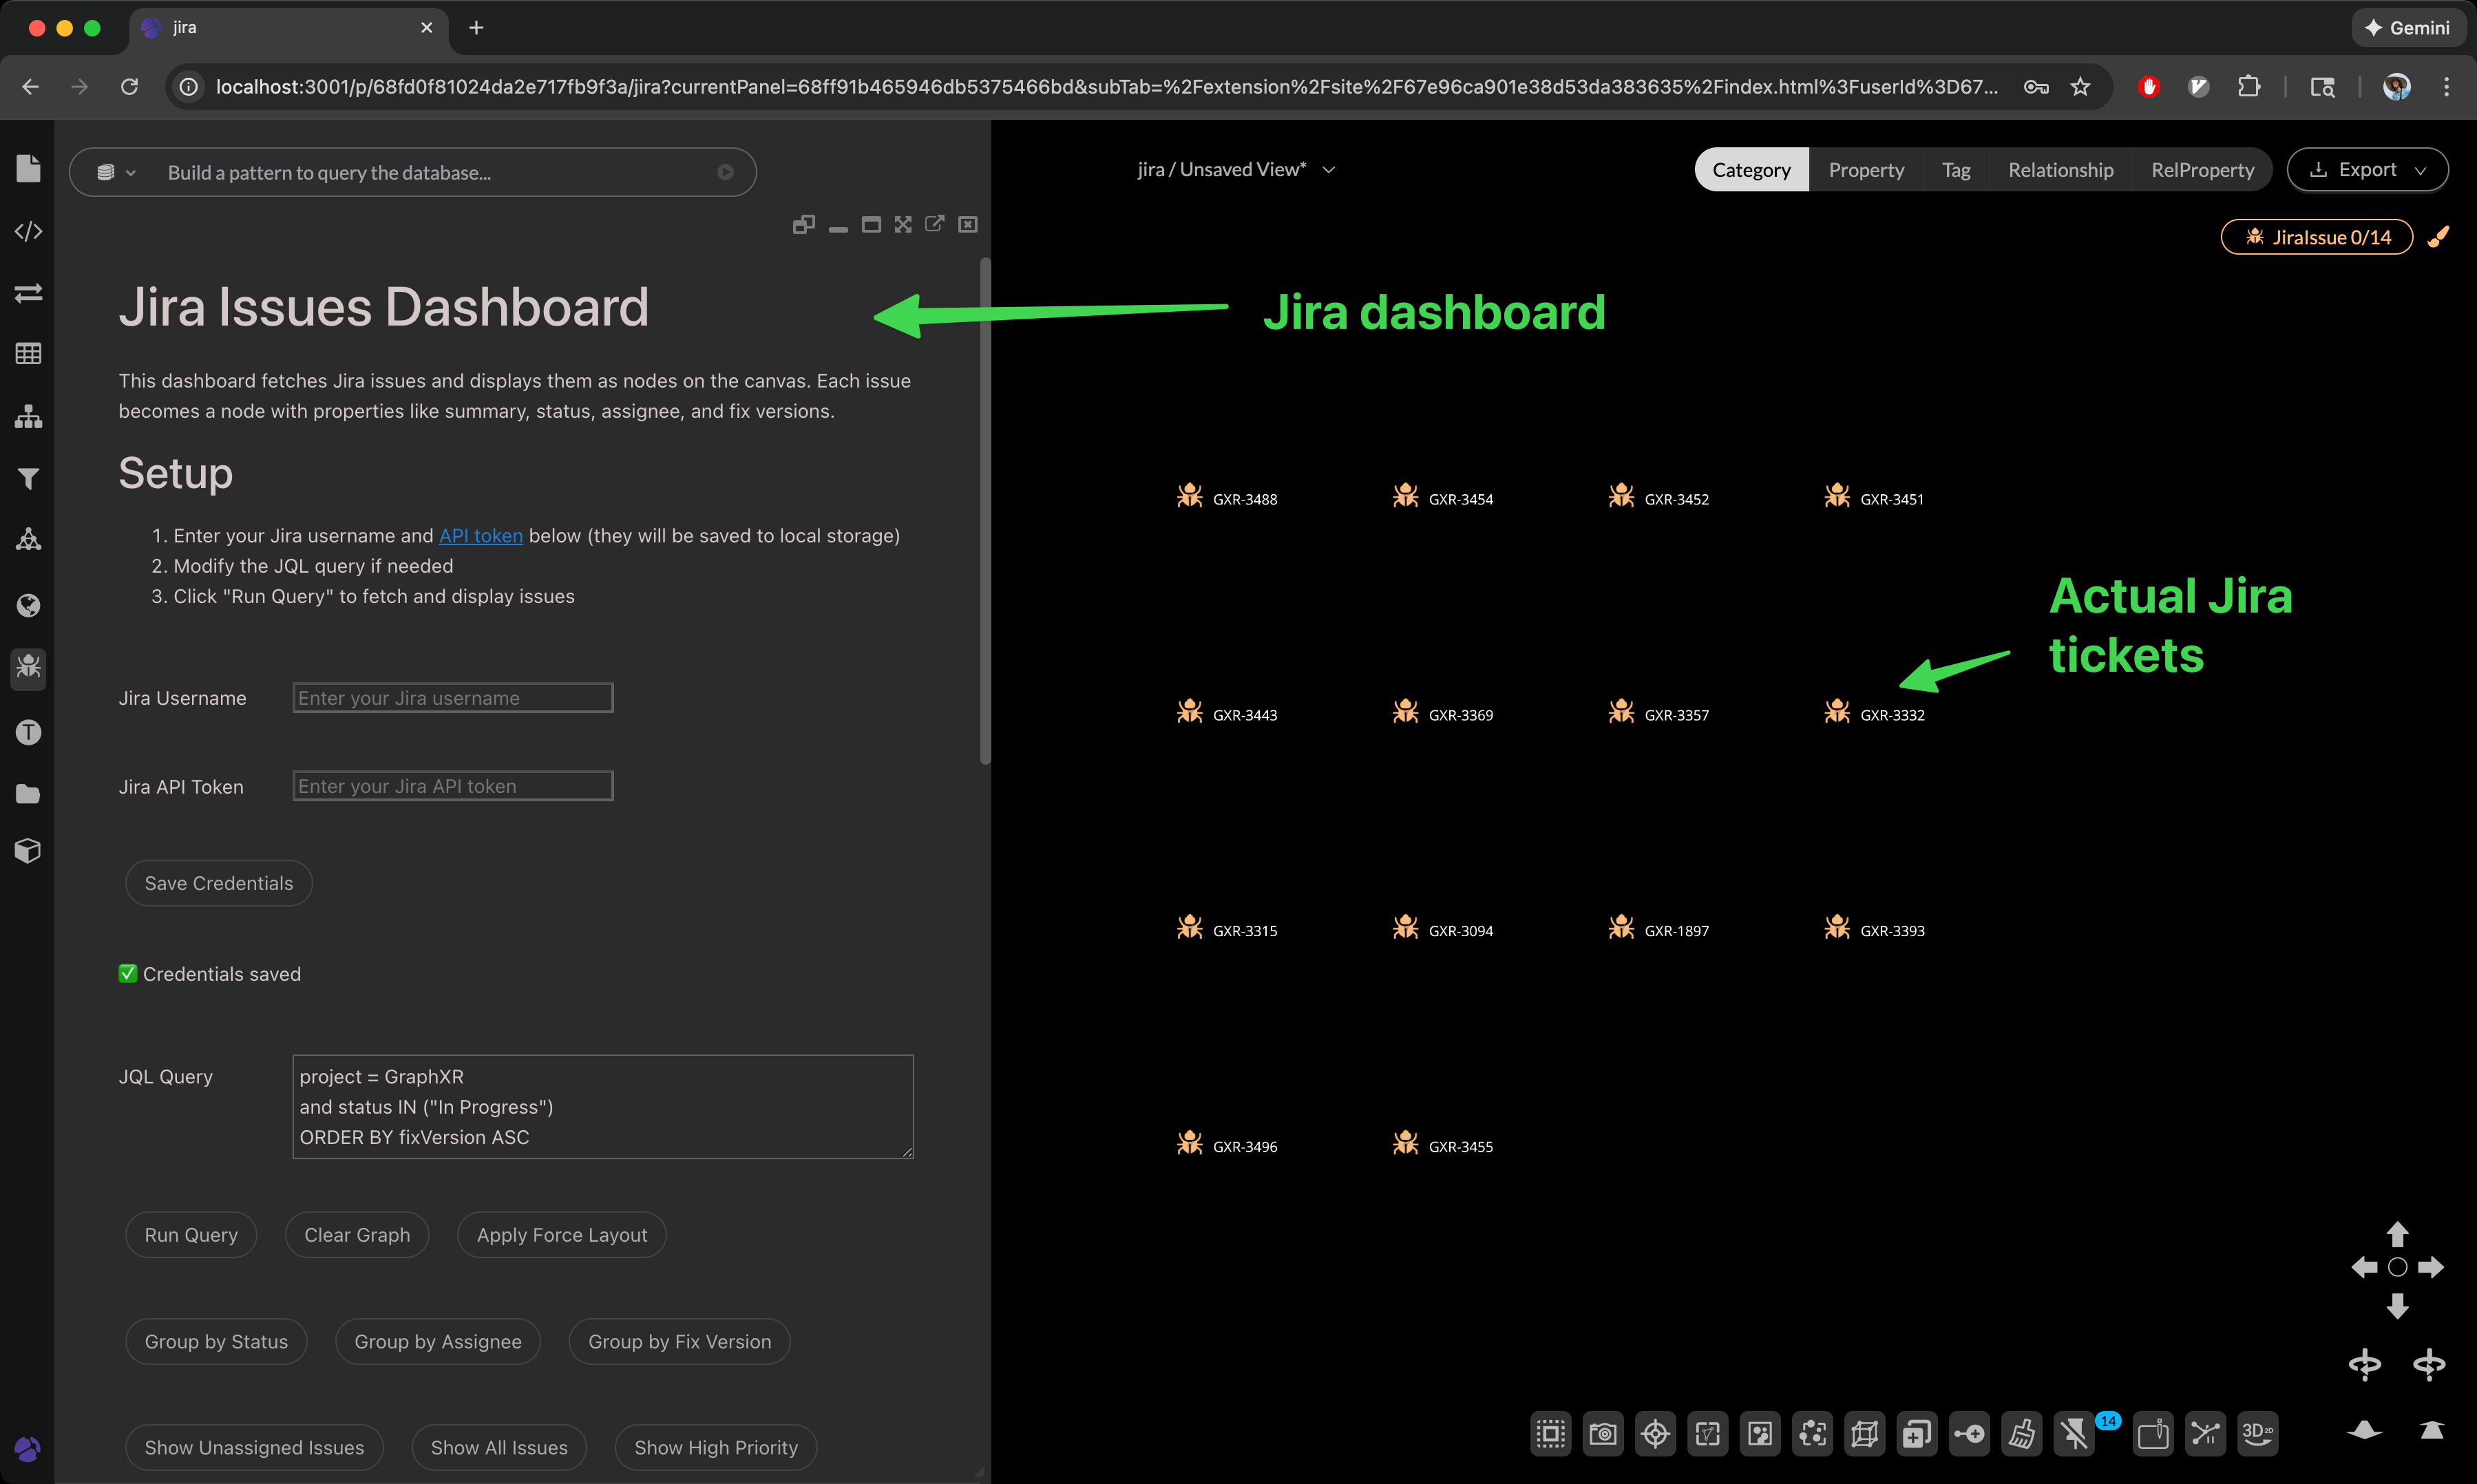 A screenshot of GraphXR with the Jira dashboard open
The JQL I ran above is:
project = GraphXR
and status IN ("In Progress")
ORDER BY fixVersion ASC
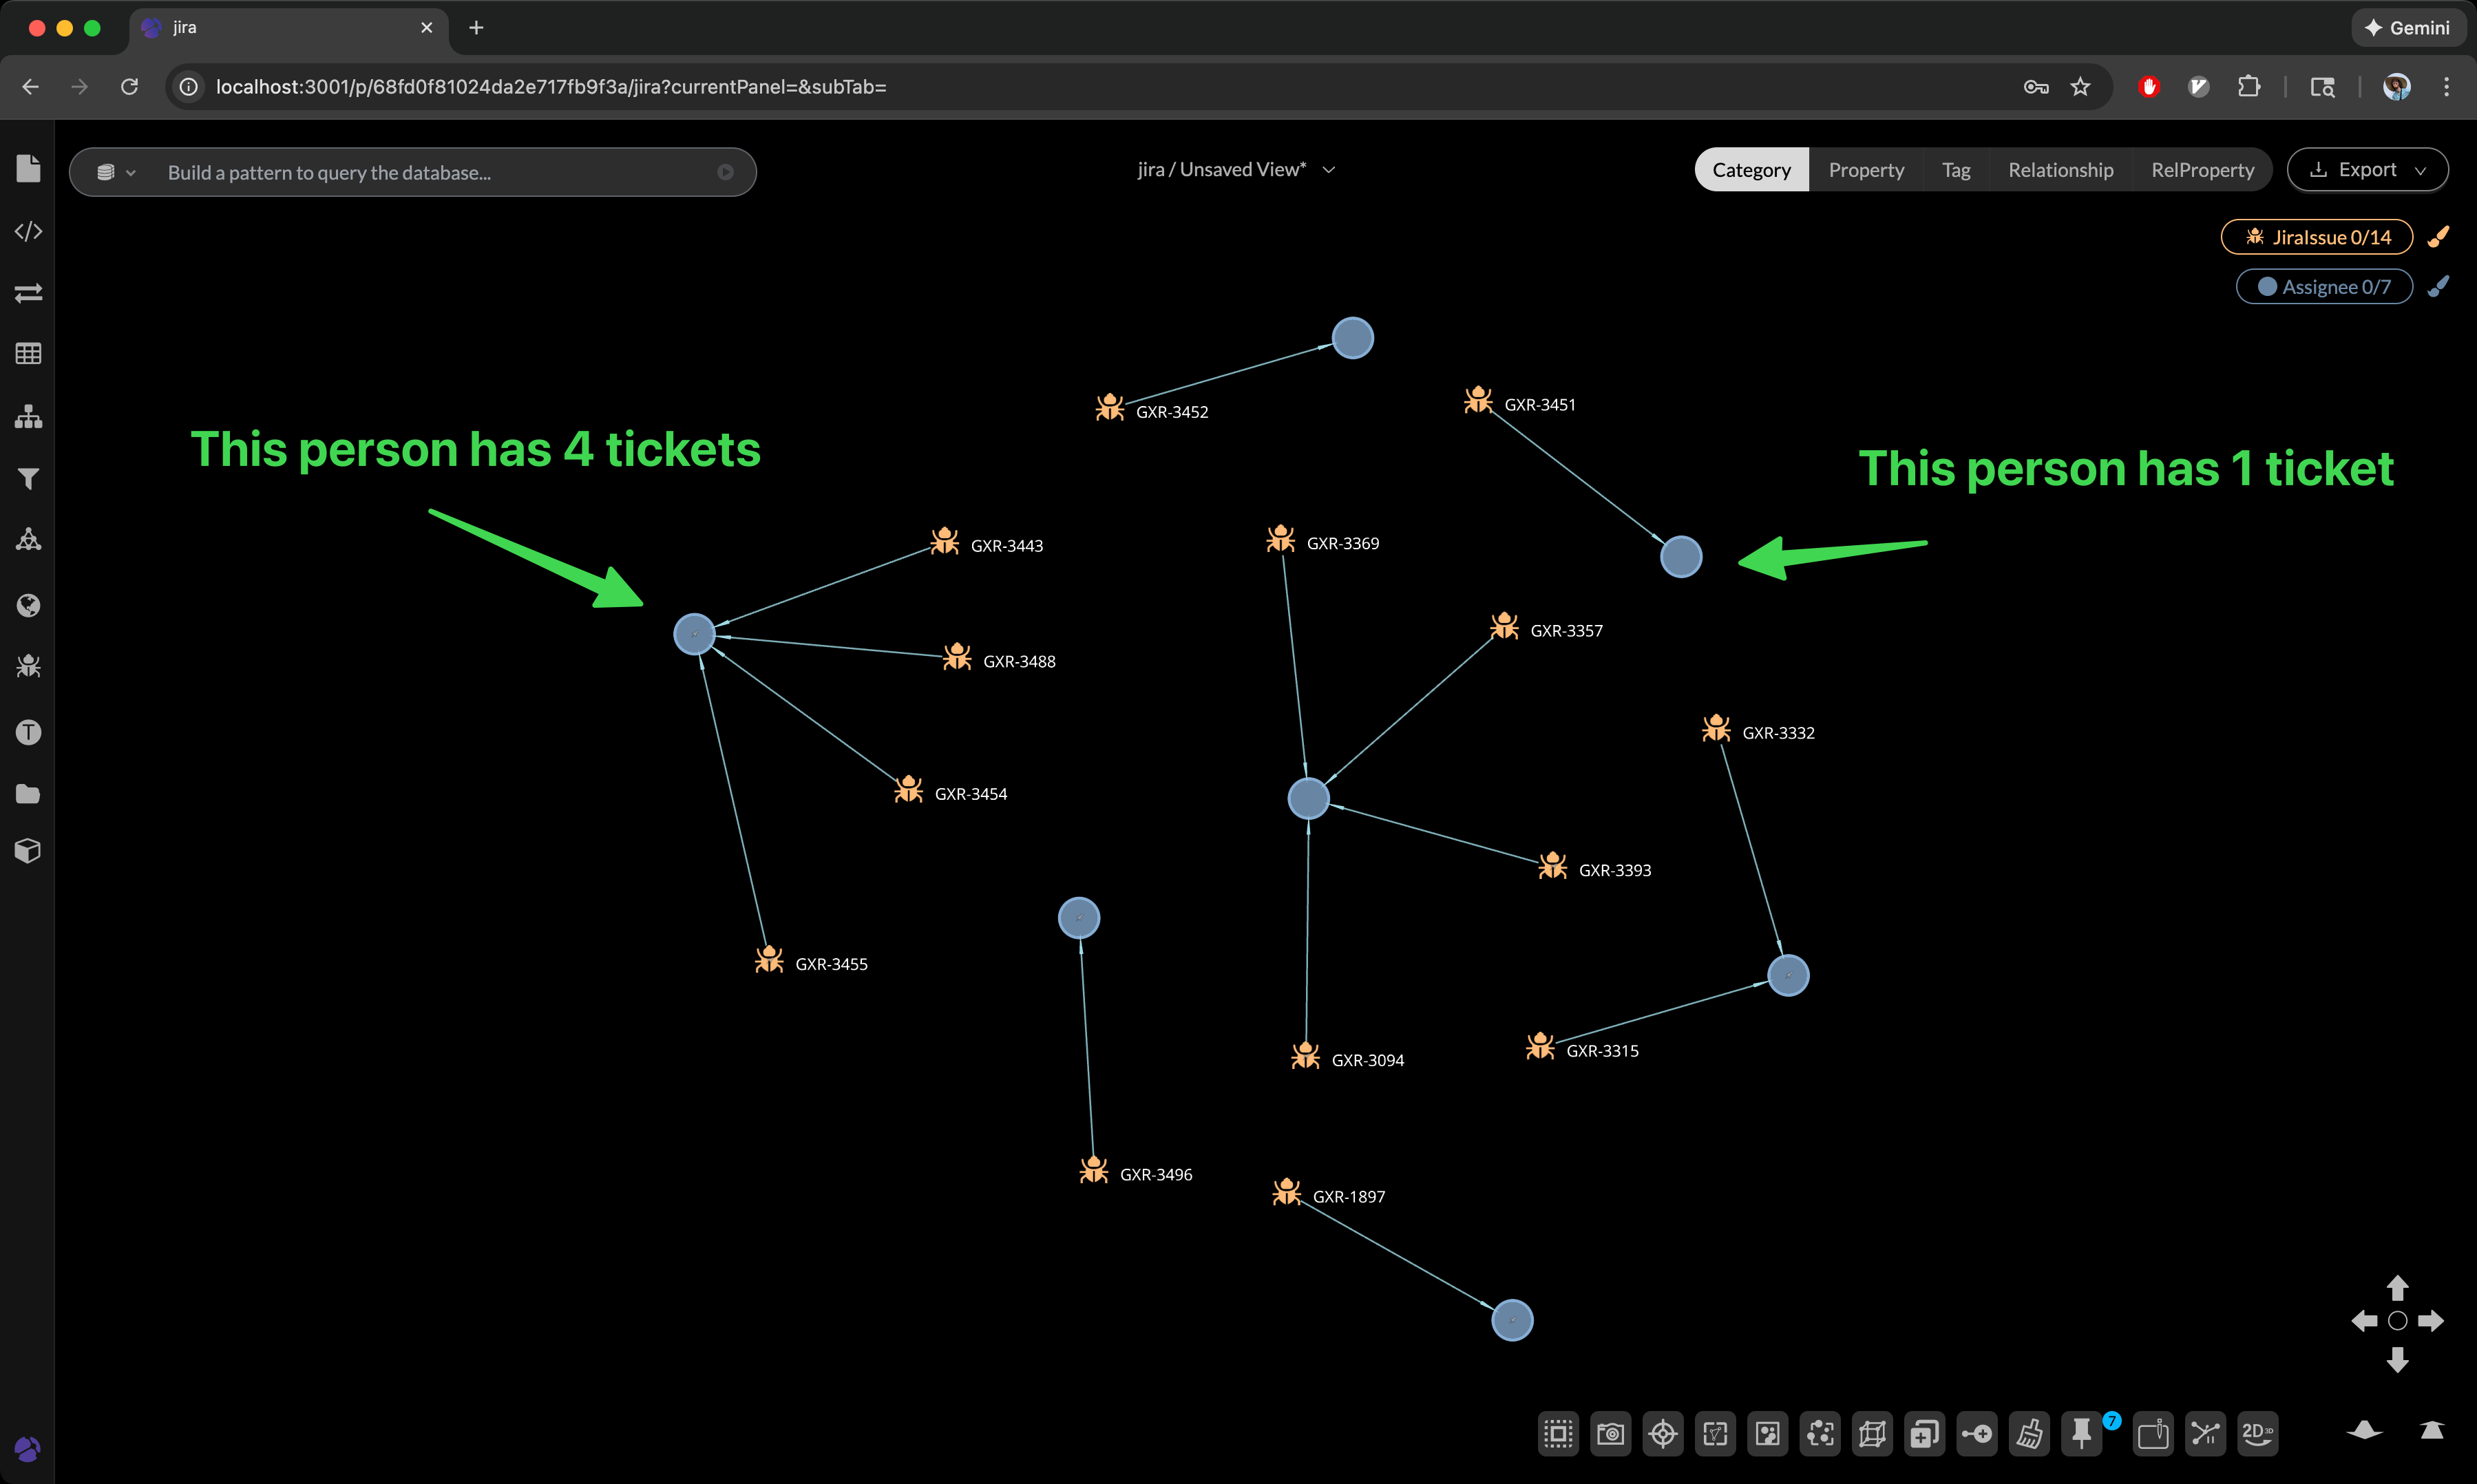
Extracting a new category called `Assignee` to see who has the most tickets
Ah, that’s better.
Find out more at https://www.kineviz.com/platform.