
Intro to BigQuery & GraphXR
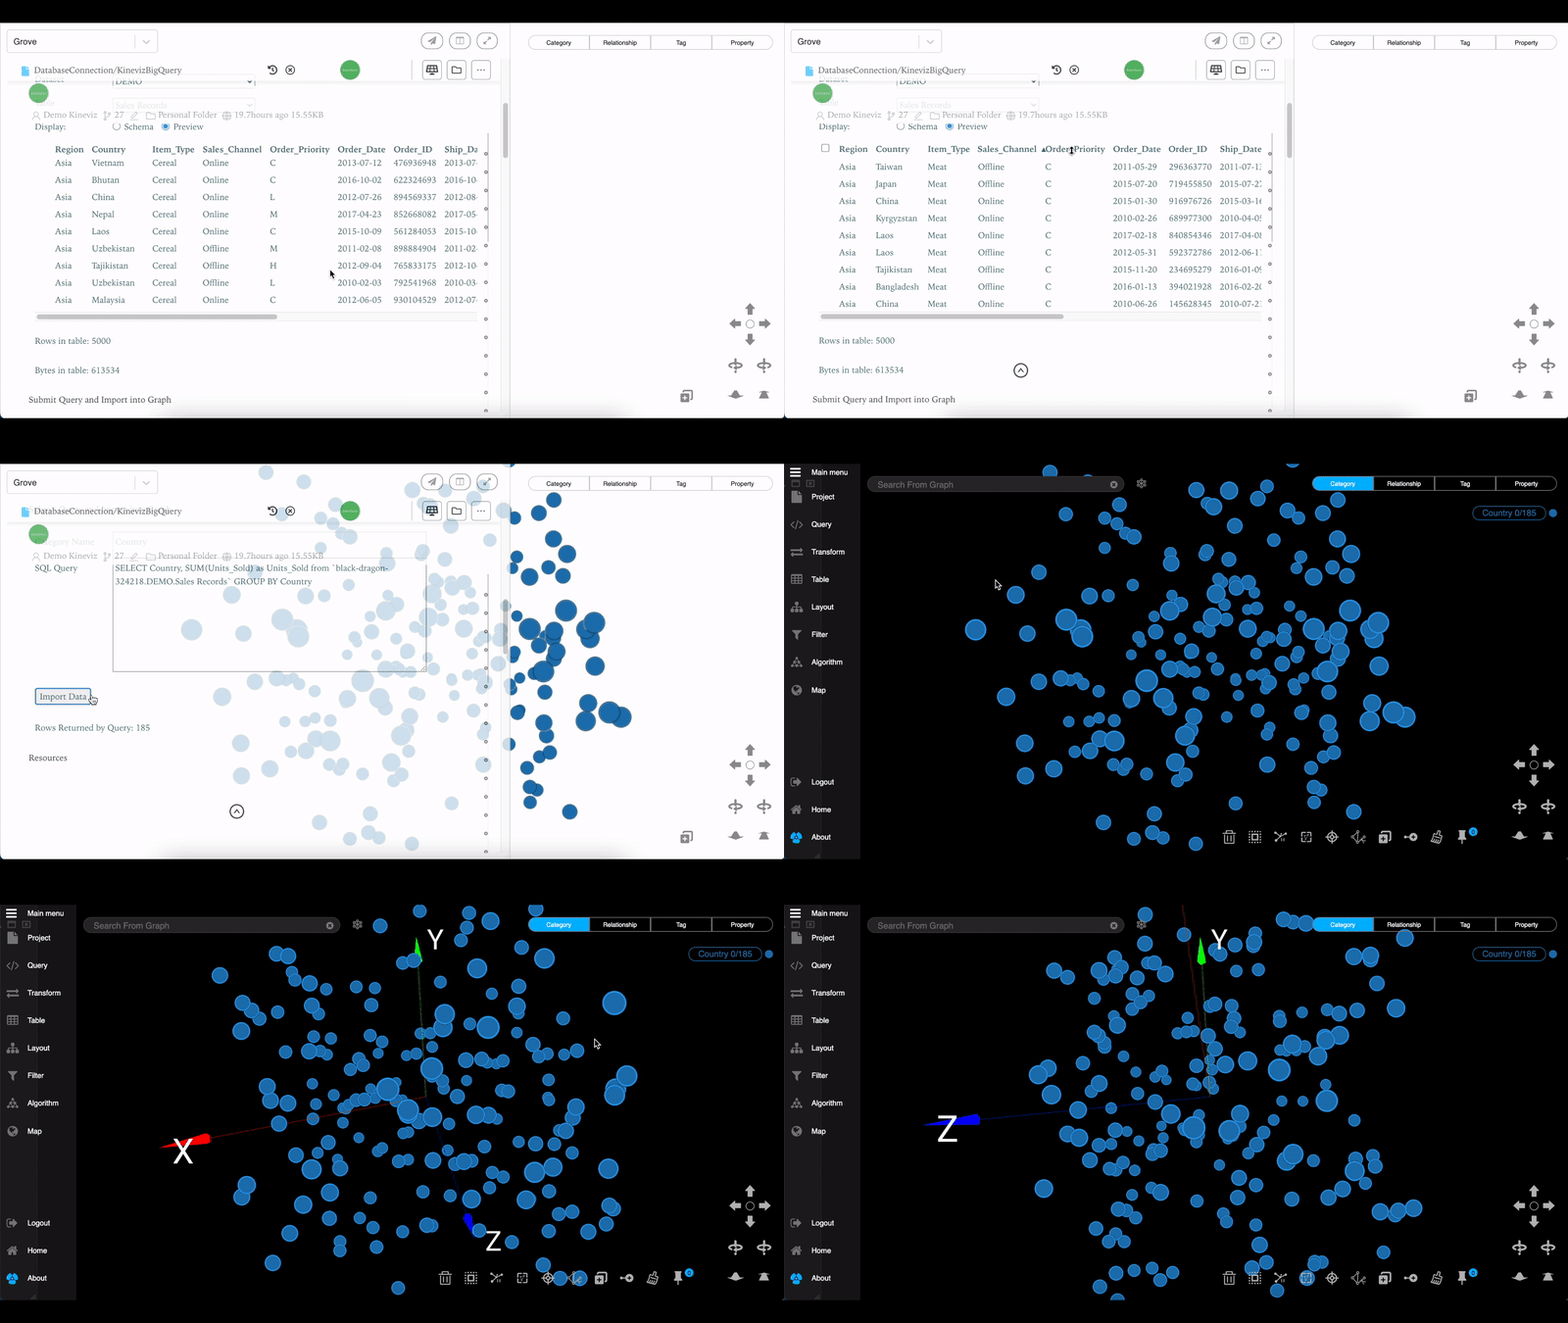
Google BigQuery is a cost-effective, serverless, multi cloud data warehouse that is suited for big data and complex SQL-based queries. Running SQL queries in a traditional SQL database can be computationally heavy and a burden to merge and aggregate data from numerous queries across tables. That is why a joint solution in working with “heavy” SQL queries more rapidly (BigQuery) and merging data through visualization (i.e. GraphXR) is a time saving solution for visualizing big data.
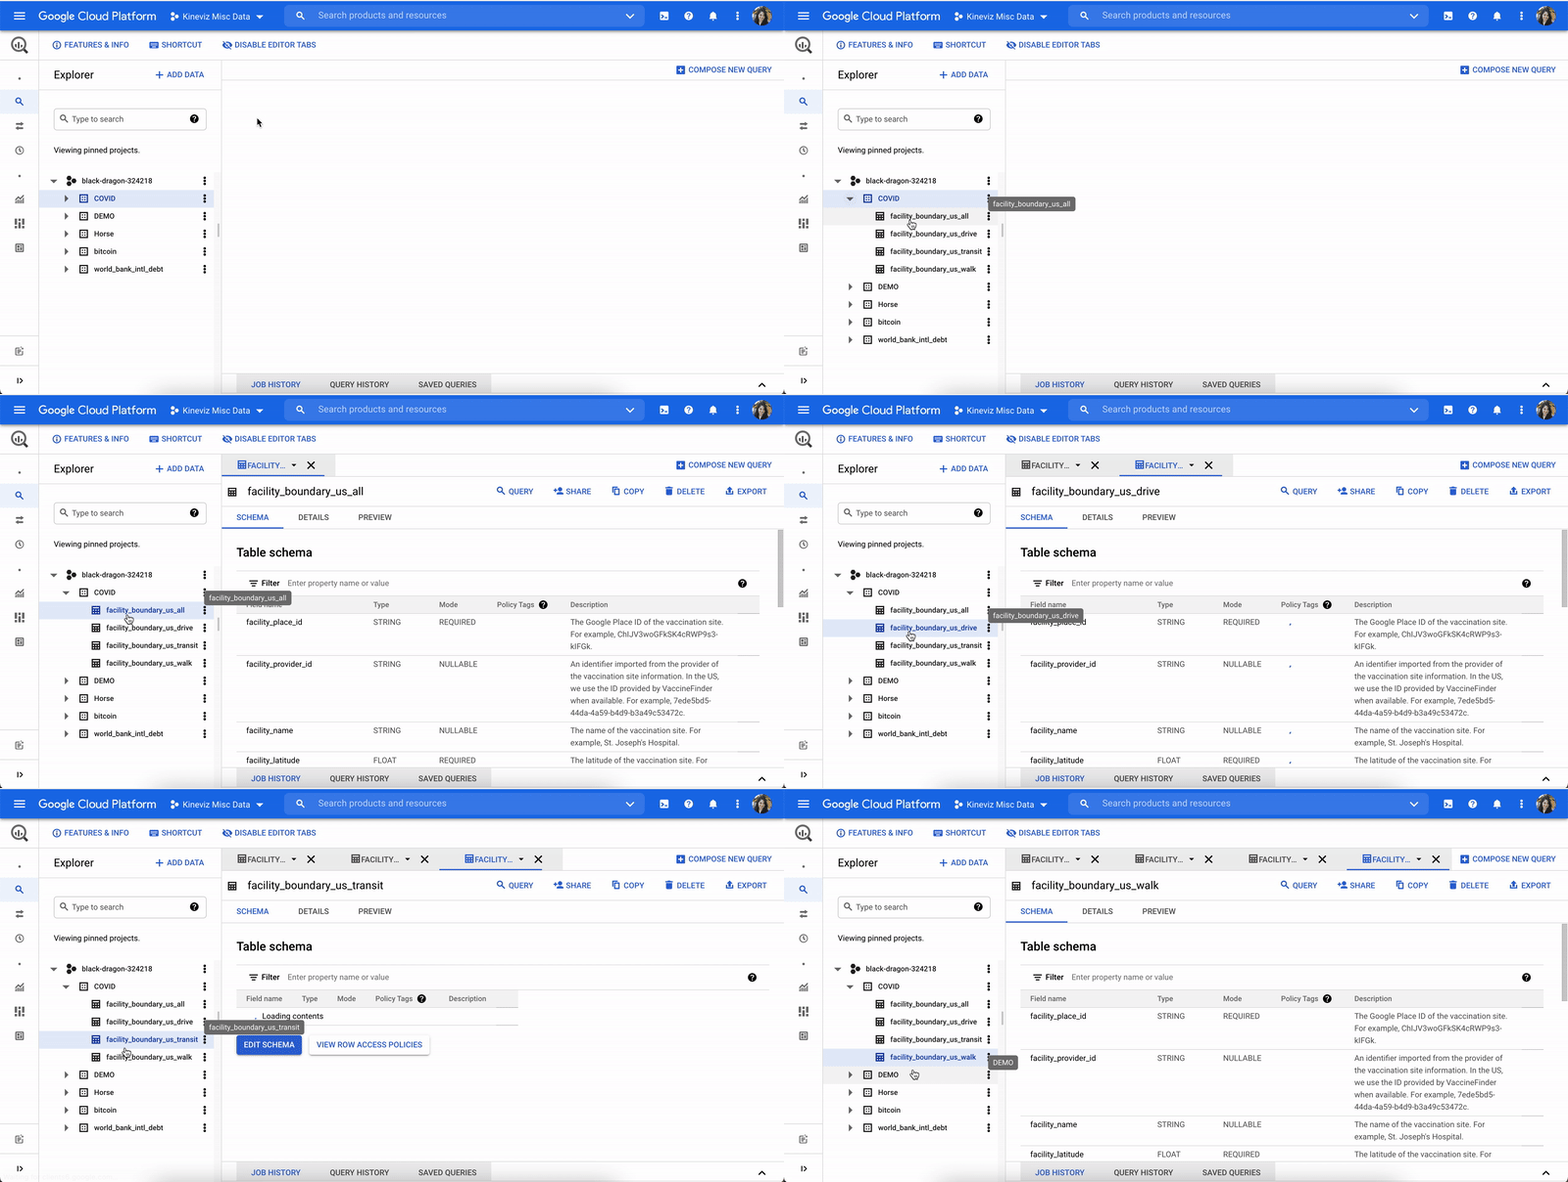
Graph Analysis in BigQuery
SQL queries can be applied across a multitude of larger datasets stored in BigQuery. This graph exploration of SQL data will be further explored in following posts using no-code data transforms such as link & filter to connect key values.
Stay tuned for our how-to blog on connecting GraphXR to BigQuery. You can also learn GraphXR today & contact us at Kineviz to learn more!